|
800
|
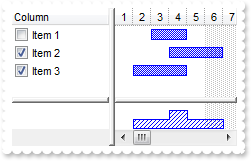
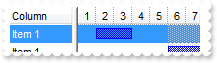
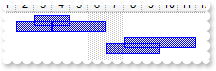
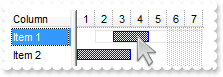
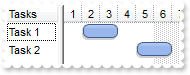
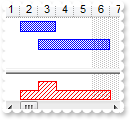
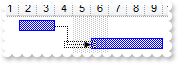
How can I change the color for a particular bar
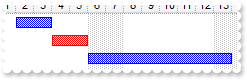
with AxG2antt1 do
begin
	Chart.FirstVisibleDate := '1/1/2001';
	Columns.Add('Column');
	with Items do
	begin
		AddBar(AddItem('Item 1'),'Task','1/2/2001','1/4/2001','B1',Nil);
		h := AddItem('Item 2');
		AddBar(h,'Task','1/4/2001','1/6/2001','B2',Nil);
		ItemBar[h,'B2',EXG2ANTTLib.ItemBarPropertyEnum.exBarColor] := TObject(255);
		AddBar(AddItem('Item 3'),'Task','1/6/2001','1/14/2001','B3',Nil);
	end;
end
|
|
799
|
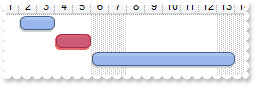
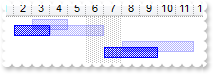
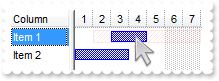
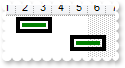
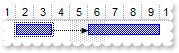
How can I change the color or visual appearance using EBN files for a particular bar
with AxG2antt1 do
begin
	VisualAppearance.Add(1,'gBFLBCJwBAEHhEJAEGg4BGoCg6AADACAxRDAMgBQKAAzQFAYZhhBaERiGEaIJhUAIIRZGMQxXAcMQvDSKQJhGLhQiSJoJDSBEgSXDIZQ5D6OZYACDJQACJYJTbAYzyPJ' +
	'kPRAA6EZCmGAwCglf5HABRb7xNLkbQ8GySKJnWCQJhoD5BSLCNRUTRFFQtGgZBpEWwLCjQNQwWLKFoTJIEPSBDKqYDoKYqTgOOZOThHQz3HakQRdAa/ZpnaKpUo2d47X' +
	'jMWBwGA0EzeAAGaxoShqdoiFaGU7UOJVJBOGwHK6BchoMAKbp6XoVWRaOAWLZWVABM7XLZxbLccyGfZ1XhdV5UbqUMznR7PNrjLKIJpCOJbbyAFwgBaeQABYLhK7iHRm' +
	'i8XYwjMWpjFWOx1GIB5LmgdB4HCEBECSIBpDGHQOicIwokYPImikEIJj6eJIloEgogSc40FGcJEFiYZIG2VIoAURw1g2QxyAQNwNAMPJOgIYI4CoDIBmAeAKBIUpQDUK' +
	'JYDoTpIB4vxgmgdgNgeYZDDoFw7CEJhQn+BohmKfImCWSZRlgYwikYMQ0gwF4DniTA/gwBJYjQYwsgoIg6AyCRQDiIJODAZBImoOguAmMZ4lQLIJjOMI3CYZJpEIT4Ki' +
	'KSI6DqD5ZGAAgHC2DAjBYR4SGUGYGE+GIlCmFhRhIB5iFAbwWsiJgMhoCoxngV4ZCcSYOHaGYnHmIg8COJpoCoOISmSWZeHWHgoEkRoAg4EIYB4NogmiSgKg6GRjGoJg' +
	'Fh+ZJKDaBYjmgaQygiBRUHmbhoDsTAyiqIIoioGoOw8aoKhKKoemeOIaAeF5HmqHoqiyKxKgYaN/locgBiuZRojoVIok8cwsjaMBLGqDoAhGIpoEYWYEmAIxUkQLZmgi' +
	'Yg2g2I4JiCQwuAqWIOIkEAQICA==');
	with Chart do
	begin
		FirstVisibleDate := '1/1/2001';
		with Bars.Item['Task'] do
		begin
			Color := $1000000;
			Height := 16;
		end;
	end;
	Columns.Add('Column');
	with Items do
	begin
		AddBar(AddItem('Item 1'),'Task','1/2/2001','1/4/2001','B1',Nil);
		h := AddItem('Item 2');
		AddBar(h,'Task','1/4/2001','1/6/2001','B2',Nil);
		ItemBar[h,'B2',EXG2ANTTLib.ItemBarPropertyEnum.exBarColor] := TObject(255);
		AddBar(AddItem('Item 3'),'Task','1/6/2001','1/14/2001','B3',Nil);
	end;
end
|
|
798
|
How can I resize programmatically a bar
with AxG2antt1 do
begin
	Chart.FirstVisibleDate := '1/1/2001';
	Columns.Add('Column');
	with Items do
	begin
		h := AddItem('Item 1');
		AddBar(h,'Task','1/4/2001','1/6/2001','B2',Nil);
		ItemBar[h,'B2',EXG2ANTTLib.ItemBarPropertyEnum.exBarDuration] := TObject(1);
	end;
end
|
|
797
|
How can I move programmatically a bar
with AxG2antt1 do
begin
	Chart.FirstVisibleDate := '1/1/2001';
	Columns.Add('Column');
	with Items do
	begin
		h := AddItem('Item 1');
		AddBar(h,'Task','1/4/2001','1/6/2001','B2',Nil);
		ItemBar[h,'B2',EXG2ANTTLib.ItemBarPropertyEnum.exBarMove] := TObject(-2);
	end;
end
|
|
796
|
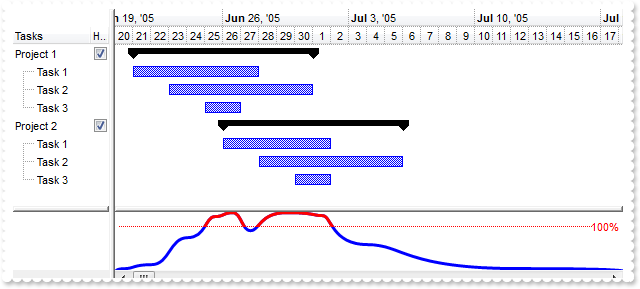
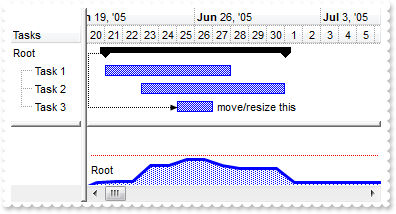
How can I select displaying the histogram for an item and all its child items
with AxG2antt1 do
begin
	BeginUpdate();
	MarkSearchColumn := False;
	ShowFocusRect := False;
	Columns.Add('Tasks');
	with (Columns.Add('Hist') as EXG2ANTTLib.Column) do
	begin
		Def[EXG2ANTTLib.DefColumnEnum.exCellHasCheckBox] := TObject(True);
		PartialCheck := True;
		AllowSizing := False;
		Width := 18;
	end;
	with Chart do
	begin
		LevelCount := 2;
		NonworkingDays := 0;
		PaneWidth[False] := 96;
		FirstVisibleDate := '6/20/2005';
		HistogramVisible := True;
		HistogramView := EXG2ANTTLib.HistogramViewEnum($10000 Or Integer(EXG2ANTTLib.HistogramViewEnum.exHistogramNoGrouping) Or Integer(EXG2ANTTLib.HistogramViewEnum.exHistogramRecLeafItems) Or Integer(EXG2ANTTLib.HistogramViewEnum.exHistogramLeafItems) Or Integer(EXG2ANTTLib.HistogramViewEnum.exHistogramUnlockedItems) Or Integer(EXG2ANTTLib.HistogramViewEnum.exHistogramCheckedItems));
		HistogramHeight := 64;
		with Bars.Item['Task'] do
		begin
			HistogramCriticalColor := $ff;
			HistogramPattern := EXG2ANTTLib.PatternEnum.exBezierCurve;
			HistogramType := EXG2ANTTLib.HistogramTypeEnum.exHistOverAllocation;
		end;
	end;
	with Items do
	begin
		h := AddItem('Project 1');
		AddBar(h,'Summary','6/21/2005','7/1/2005',Nil,Nil);
		h1 := InsertItem(h,Nil,'Task 1');
		AddBar(h1,'Task','6/21/2005','6/28/2005',Nil,Nil);
		CellMerge[TObject(h1),TObject(0)] := TObject(1);
		DefineSummaryBars(h,'',h1,'');
		h1 := InsertItem(h,Nil,'Task 2');
		AddBar(h1,'Task','6/23/2005','7/1/2005','E',Nil);
		CellMerge[TObject(h1),TObject(0)] := TObject(1);
		DefineSummaryBars(h,'',h1,'E');
		ItemBar[h1,'E',EXG2ANTTLib.ItemBarPropertyEnum.exBarEffort] := TObject(5);
		h1 := InsertItem(h,Nil,'Task 3');
		AddBar(h1,'Task','6/25/2005','6/27/2005','E',Nil);
		CellMerge[TObject(h1),TObject(0)] := TObject(1);
		DefineSummaryBars(h,'',h1,'E');
		ExpandItem[h] := True;
		CellState[TObject(h),TObject(1)] := 1;
		h := AddItem('Project 2');
		AddBar(h,'Summary','6/26/2005','7/6/2005',Nil,Nil);
		h1 := InsertItem(h,Nil,'Task 1');
		AddBar(h1,'Task','6/26/2005','7/2/2005',Nil,Nil);
		CellMerge[TObject(h1),TObject(0)] := TObject(1);
		DefineSummaryBars(h,'',h1,'');
		h1 := InsertItem(h,Nil,'Task 2');
		AddBar(h1,'Task','6/28/2005','7/6/2005','E',Nil);
		CellMerge[TObject(h1),TObject(0)] := TObject(1);
		DefineSummaryBars(h,'',h1,'E');
		ItemBar[h1,'E',EXG2ANTTLib.ItemBarPropertyEnum.exBarEffort] := TObject(5);
		h1 := InsertItem(h,Nil,'Task 3');
		AddBar(h1,'Task','6/30/2005','7/2/2005','E',Nil);
		CellMerge[TObject(h1),TObject(0)] := TObject(1);
		DefineSummaryBars(h,'',h1,'E');
		ExpandItem[h] := True;
		CellState[TObject(h),TObject(1)] := 1;
	end;
	EndUpdate();
end
|
|
795
|
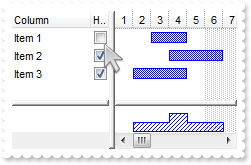
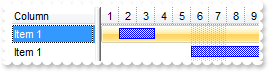
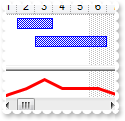
How can I select or specify the items being included in the histogram, (using a different column )
with AxG2antt1 do
begin
	BeginUpdate();
	MarkSearchColumn := False;
	with Chart do
	begin
		FirstVisibleDate := '1/1/2001';
		HistogramVisible := True;
		HistogramView := EXG2ANTTLib.HistogramViewEnum($10000 Or Integer(EXG2ANTTLib.HistogramViewEnum.exHistogramCheckedItems));
		HistogramHeight := 32;
		Bars.Item['Task'].HistogramPattern := EXG2ANTTLib.PatternEnum.exPatternBDiagonal;
	end;
	Columns.Add('Column');
	with (Columns.Add('Histogram') as EXG2ANTTLib.Column) do
	begin
		Def[EXG2ANTTLib.DefColumnEnum.exCellHasCheckBox] := TObject(True);
		AllowSizing := False;
		Width := 18;
	end;
	with Items do
	begin
		AddBar(AddItem('Item 1'),'Task','1/3/2001','1/5/2001',Nil,Nil);
		h := AddItem('Item 2');
		AddBar(h,'Task','1/4/2001','1/7/2001',Nil,Nil);
		CellState[TObject(h),TObject(1)] := 1;
		h := AddItem('Item 3');
		AddBar(h,'Task','1/2/2001','1/5/2001',Nil,Nil);
		CellState[TObject(h),TObject(1)] := 1;
	end;
	EndUpdate();
end
|
|
794
|
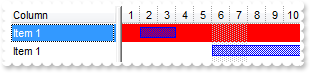
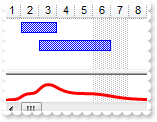
How can I select or specify the items being included in the histogram
with AxG2antt1 do
begin
	BeginUpdate();
	with Chart do
	begin
		FirstVisibleDate := '1/1/2001';
		HistogramVisible := True;
		HistogramView := EXG2ANTTLib.HistogramViewEnum.exHistogramCheckedItems;
		HistogramHeight := 32;
		Bars.Item['Task'].HistogramPattern := EXG2ANTTLib.PatternEnum.exPatternBDiagonal;
	end;
	(Columns.Add('Column') as EXG2ANTTLib.Column).Def[EXG2ANTTLib.DefColumnEnum.exCellHasCheckBox] := TObject(True);
	with Items do
	begin
		AddBar(AddItem('Item 1'),'Task','1/3/2001','1/5/2001',Nil,Nil);
		h := AddItem('Item 2');
		AddBar(h,'Task','1/4/2001','1/7/2001',Nil,Nil);
		CellState[TObject(h),TObject(0)] := 1;
		h := AddItem('Item 3');
		AddBar(h,'Task','1/2/2001','1/5/2001',Nil,Nil);
		CellState[TObject(h),TObject(0)] := 1;
	end;
	EndUpdate();
end
|
|
793
|
Is there any option to display the histogram for selected items only
with AxG2antt1 do
begin
	BeginUpdate();
	SingleSel := False;
	with Chart do
	begin
		FirstVisibleDate := '1/1/2001';
		HistogramVisible := True;
		HistogramView := EXG2ANTTLib.HistogramViewEnum.exHistogramSelectedItems;
		HistogramHeight := 32;
		Bars.Item['Task'].HistogramPattern := EXG2ANTTLib.PatternEnum.exPatternBDiagonal;
	end;
	Columns.Add('Column');
	with Items do
	begin
		AddBar(AddItem('Item 1'),'Task','1/3/2001','1/5/2001',Nil,Nil);
		AddBar(AddItem('Item 2'),'Task','1/4/2001','1/7/2001',Nil,Nil);
		AddBar(AddItem('Item 3'),'Task','1/2/2001','1/6/2001',Nil,Nil);
		SelectAll();
	end;
	EndUpdate();
end
|
|
792
|
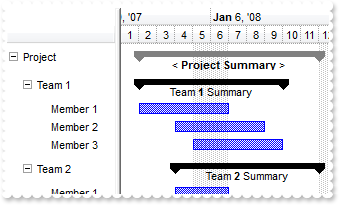
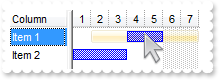
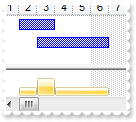
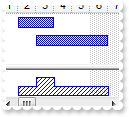
Is it possible to add bars to a summary bar so, they get resized or moved as soon as a bar is changed
with AxG2antt1 do
begin
	BeginUpdate();
	BackColor := Color.FromArgb(255,255,255);
	ShowFocusRect := False;
	HasLines := EXG2ANTTLib.HierarchyLineEnum.exNoLine;
	LinesAtRoot := EXG2ANTTLib.LinesAtRootEnum.exLinesAtRoot;
	HasLines := EXG2ANTTLib.HierarchyLineEnum.exNoLine;
	Indent := 14;
	FullRowSelect := EXG2ANTTLib.CellSelectEnum.exColumnSel;
	ScrollBySingleLine := True;
	with Chart do
	begin
		BackColor := $ffffff;
		SelBackColor := $f5f5f5;
		AllowCreateBar := EXG2ANTTLib.CreateBarEnum.exNoCreateBar;
		AllowLinkBars := False;
		FirstVisibleDate := '1/1/2008';
		LevelCount := 2;
		PaneWidth[False] := 98;
	end;
	Columns.Add('');
	with Items do
	begin
		hProject := AddItem('Project');
		ItemHeight[hProject] := 26;
		AddBar(hProject,'Project Summary','1/2/2008','1/5/2008',Nil,Nil);
		ItemBar[hProject,'',EXG2ANTTLib.ItemBarPropertyEnum.exBarCaption] := '<br>< <b>Project Summary</b> >';
		hR1 := InsertItem(hProject,Nil,'Team 1');
		ItemHeight[hR1] := 30;
		AddBar(hR1,'Summary','1/2/2008','1/8/2008',Nil,Nil);
		ItemBar[hR1,'',EXG2ANTTLib.ItemBarPropertyEnum.exBarCaption] := '<br> Team <b>1</b> Summary ';
		h1 := InsertItem(hR1,Nil,'Member 1');
		AddBar(h1,'Task','1/2/2008','1/7/2008',Nil,Nil);
		DefineSummaryBars(hR1,'',h1,'');
		h1 := InsertItem(hR1,Nil,'Member 2');
		AddBar(h1,'Task','1/4/2008','1/9/2008',Nil,Nil);
		DefineSummaryBars(hR1,'',h1,'');
		h1 := InsertItem(hR1,Nil,'Member 3');
		AddBar(h1,'Task','1/5/2008','1/10/2008',Nil,Nil);
		DefineSummaryBars(hR1,'',h1,'');
		ExpandItem[hR1] := True;
		hR2 := InsertItem(hProject,Nil,'Team 2');
		ItemHeight[hR2] := 30;
		AddBar(hR2,'Summary','1/2/2008','1/8/2008',Nil,Nil);
		ItemBar[hR2,'',EXG2ANTTLib.ItemBarPropertyEnum.exBarCaption] := '<br> Team <b>2</b> Summary ';
		h2 := InsertItem(hR2,Nil,'Member 1');
		AddBar(h2,'Task','1/4/2008','1/7/2008',Nil,Nil);
		DefineSummaryBars(hR2,'',h2,'');
		h2 := InsertItem(hR2,Nil,'Member 2');
		AddBar(h2,'Task','1/8/2008','1/11/2008',Nil,Nil);
		DefineSummaryBars(hR2,'',h2,'');
		h2 := InsertItem(hR2,Nil,'Member 3');
		AddBar(h2,'Task','1/5/2008','1/12/2008',Nil,Nil);
		DefineSummaryBars(hR2,'',h2,'');
		ExpandItem[hR2] := True;
		ExpandItem[FirstVisibleItem] := True;
		DefineSummaryBars(hProject,'',hR1,'');
		DefineSummaryBars(hProject,'',hR2,'');
	end;
	EndUpdate();
end
|
|
791
|
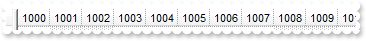
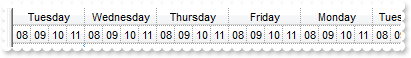
Is it possible to define level in terms of just increasing numbers (not a Date)
with AxG2antt1 do
begin
	with Chart do
	begin
		PaneWidth[False] := 32;
		UnitWidth := 32;
		FirstVisibleDate := TObject(1000);
		Level[0].Label := '<%i%>';
	end;
end
|
|
790
|
How can I hide the non-working units ( days or hours )
with AxG2antt1 do
begin
	BeginUpdate();
	with Chart do
	begin
		PaneWidth[False] := 0;
		LevelCount := 2;
		with Level[0] do
		begin
			Label := '<%dddd%>';
			Alignment := EXG2ANTTLib.AlignmentEnum.CenterAlignment;
		end;
		Level[1].Label := TObject(65536);
		NonworkingHours := 16773375;
		ShowNonworkingUnits := False;
		ShowNonworkingDates := False;
		ShowNonworkingHours := False;
	end;
	EndUpdate();
end
|
|
789
|
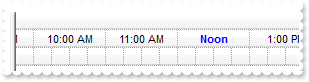
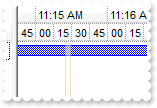
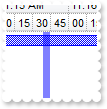
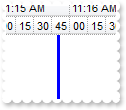
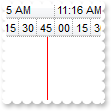
Is there a way to have the display show the word "Noon" instead "12:00 PM" in the chart's header/levels
with AxG2antt1 do
begin
	with Chart do
	begin
		PaneWidth[False] := 0;
		FirstVisibleDate := '1/1/2001 10:00:00 AM';
		LevelCount := 3;
		with Level[0] do
		begin
			Label := '<b><%mmm%> <%d%>, <%yyyy%></b>';
			Alignment := EXG2ANTTLib.AlignmentEnum.CenterAlignment;
			Unit := EXG2ANTTLib.UnitEnum.exDay;
		end;
		with Level[1] do
		begin
			Label := '<%h%>:00 <%AM/PM%>';
			Alignment := EXG2ANTTLib.AlignmentEnum.CenterAlignment;
			Unit := EXG2ANTTLib.UnitEnum.exHour;
			DrawTickLines := EXG2ANTTLib.LevelLineEnum.exLevelDefaultLine;
			DrawGridLines := True;
			ReplaceLabel['12:00 PM'] := '<fgcolor=0000FF><b>Noon</b></fgcolor>';
		end;
		with Level[2] do
		begin
			Label := '';
			Unit := EXG2ANTTLib.UnitEnum.exMinute;
			Count := 15;
		end;
	end;
end
|
|
788
|
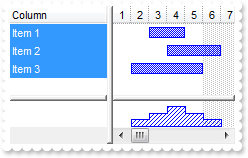
How can I change the selection background color in the chart area
with AxG2antt1 do
begin
	Chart.FirstVisibleDate := '1/1/2001';
	Chart.SelBackColor := $ff;
	Columns.Add('Column');
	with Items do
	begin
		AddBar(AddItem('Item 1'),'Task','1/2/2001','1/4/2001',Nil,Nil);
		AddBar(AddItem('Item 1'),'Task','1/6/2001','1/14/2001',Nil,Nil);
		SelectItem[FirstVisibleItem] := True;
	end;
end
|
|
787
|
How can I change the selection background color in the chart area
with AxG2antt1 do
begin
	VisualAppearance.Add(1,'c:\exontrol\images\normal.ebn');
	Chart.FirstVisibleDate := '1/1/2001';
	Chart.SelBackColor := $1000000;
	Columns.Add('Column');
	with Items do
	begin
		AddBar(AddItem('Item 1'),'Task','1/2/2001','1/4/2001',Nil,Nil);
		AddBar(AddItem('Item 1'),'Task','1/6/2001','1/14/2001',Nil,Nil);
		SelectItem[FirstVisibleItem] := True;
	end;
end
|
|
786
|
Is there any way to extend the selection on the chart
with AxG2antt1 do
begin
	Chart.FirstVisibleDate := '1/1/2001';
	Chart.SelBackColor := AxG2antt1.SelBackColor;
	Columns.Add('Column');
	with Items do
	begin
		AddBar(AddItem('Item 1'),'Task','1/2/2001','1/4/2001',Nil,Nil);
		AddBar(AddItem('Item 1'),'Task','1/6/2001','1/14/2001',Nil,Nil);
		SelectItem[FirstVisibleItem] := True;
	end;
end
|
|
785
|
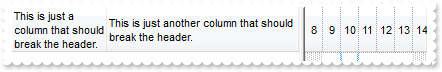
How can I display the column's header using multiple lines
with AxG2antt1 do
begin
	HeaderHeight := 128;
	HeaderSingleLine := False;
	(Columns.Add('This is just a column that should break the header.') as EXG2ANTTLib.Column).Width := 32;
	Columns.Add('This is just another column that should break the header.');
end
|
|
784
|
Can I move or limit moving or resizing a bar
with AxG2antt1 do
begin
	BeginUpdate();
	ScrollBySingleLine := True;
	DrawGridLines := EXG2ANTTLib.GridLinesEnum.exAllLines;
	DefaultItemHeight := 19;
	GridLineColor := Color.FromArgb(220,220,220);
	with Chart do
	begin
		FirstVisibleDate := '1/1/2001';
		ScrollRange[EXG2ANTTLib.ScrollRangeEnum.exStartDate] := '12/28/2000';
		ScrollRange[EXG2ANTTLib.ScrollRangeEnum.exEndDate] := '1/12/2001';
		DrawDateTicker := True;
		NonworkingDays := 0;
		DrawGridLines := EXG2ANTTLib.GridLinesEnum.exAllLines;
		ResizeUnitScale := EXG2ANTTLib.UnitEnum.exHour;
		AllowCreateBar := EXG2ANTTLib.CreateBarEnum.exNoCreateBar;
		PaneWidth[False] := 128;
		LevelCount := 2;
		Level[0].DrawGridLines := False;
		AllowLinkBars := False;
		Bars.Item['Task'].OverlaidType := Integer(EXG2ANTTLib.OverlaidBarsTypeEnum.exOverlaidBarsStackAutoArrange) Or Integer(EXG2ANTTLib.OverlaidBarsTypeEnum.exOverlaidBarsStack);
	end;
	Columns.Add('Info');
	with Items do
	begin
		h := AddItem('Fixed bar');
		AddBar(h,'Task','1/2/2001','1/5/2001','F',Nil);
		ItemBar[h,'F',EXG2ANTTLib.ItemBarPropertyEnum.exBarCanResize] := TObject(False);
		ItemBar[h,'F',EXG2ANTTLib.ItemBarPropertyEnum.exBarCanMove] := TObject(False);
		ItemBar[h,'F',EXG2ANTTLib.ItemBarPropertyEnum.exBarToolTip] := 'This bar is fixed, so the uer can move or resize it';
		h := AddItem('Moveable but not-resizable bar');
		AddBar(h,'Task','1/3/2001','1/6/2001','F',Nil);
		ItemBar[h,'F',EXG2ANTTLib.ItemBarPropertyEnum.exBarToolTip] := 'This bar is moveable inside the item, but the user can''t resize it.';
		ItemBar[h,'F',EXG2ANTTLib.ItemBarPropertyEnum.exBarCanResize] := TObject(False);
		h := AddItem('Resizable but not moveable bar');
		AddBar(h,'Task','1/3/2001','1/6/2001','F',Nil);
		ItemBar[h,'F',EXG2ANTTLib.ItemBarPropertyEnum.exBarToolTip] := 'This bar is resizable but the user can''t move it.';
		ItemBar[h,'F',EXG2ANTTLib.ItemBarPropertyEnum.exBarCanMove] := TObject(False);
		h := AddItem('Range Moveable bar');
		AddBar(h,'Task','1/2/2001','1/6/2001','F',Nil);
		ItemBar[h,'F',EXG2ANTTLib.ItemBarPropertyEnum.exBarToolTip] := 'This bar can be moved inside the displayed range.';
		ItemBar[h,'F',EXG2ANTTLib.ItemBarPropertyEnum.exBarMinStart] := '1/2/2001';
		ItemBar[h,'F',EXG2ANTTLib.ItemBarPropertyEnum.exBarMaxEnd] := '1/8/2001';
		ItemBar[h,'F',EXG2ANTTLib.ItemBarPropertyEnum.exBarShowRange] := TObject(32);
		ItemBar[h,'F',EXG2ANTTLib.ItemBarPropertyEnum.exBarShowRangeTransparent] := TObject(90);
		h := AddItem('Range Moveable Upper No Limit bar');
		AddBar(h,'Task','1/3/2001','1/6/2001','F',Nil);
		ItemBar[h,'F',EXG2ANTTLib.ItemBarPropertyEnum.exBarToolTip] := 'This bar can be moved inside the displayed range.';
		ItemBar[h,'F',EXG2ANTTLib.ItemBarPropertyEnum.exBarMinStart] := '1/2/2001';
		ItemBar[h,'F',EXG2ANTTLib.ItemBarPropertyEnum.exBarShowRange] := TObject(32);
		ItemBar[h,'F',EXG2ANTTLib.ItemBarPropertyEnum.exBarShowRangeTransparent] := TObject(90);
		h := AddItem('Range Moveable Lower No Limit bar');
		AddBar(h,'Task','1/3/2001','1/6/2001','F',Nil);
		ItemBar[h,'F',EXG2ANTTLib.ItemBarPropertyEnum.exBarToolTip] := 'This bar can be moved inside the displayed range.';
		ItemBar[h,'F',EXG2ANTTLib.ItemBarPropertyEnum.exBarMaxEnd] := '1/8/2001';
		ItemBar[h,'F',EXG2ANTTLib.ItemBarPropertyEnum.exBarShowRange] := TObject(32);
		ItemBar[h,'F',EXG2ANTTLib.ItemBarPropertyEnum.exBarShowRangeTransparent] := TObject(90);
		h := AddItem('Moveable bar inside the item');
		AddBar(h,'Task','1/2/2001','1/6/2001','F',Nil);
		ItemBar[h,'F',EXG2ANTTLib.ItemBarPropertyEnum.exBarToolTip] := 'This bar can be moved/resized anywhere inside the item.';
		h := AddItem('Moveable bar to other items too');
		AddBar(h,'Task','1/2/2001','1/6/2001','FA',Nil);
		ItemBar[h,'FA',EXG2ANTTLib.ItemBarPropertyEnum.exBarToolTip] := 'This bar can be moved to other items too. Click the bar and move it to other items too.';
		ItemBar[h,'FA',EXG2ANTTLib.ItemBarPropertyEnum.exBarCaption] := 'free';
		ItemBar[h,'FA',EXG2ANTTLib.ItemBarPropertyEnum.exBarHAlignCaption] := TObject(18);
		ItemBar[h,'FA',EXG2ANTTLib.ItemBarPropertyEnum.exBarCanMoveToAnother] := TObject(True);
		h := AddItem('Moveable inside item');
		AddBar(h,'Task','1/3/2001','1/5/2001','F1',Nil);
		h := AddItem('Moveable inside item');
		AddBar(h,'Task','1/3/2001','1/5/2001','F1',Nil);
		h := AddItem('Moveable inside item');
		AddBar(h,'Task','1/3/2001','1/5/2001','F1',Nil);
	end;
	EndUpdate();
end
|
|
783
|
Can I move a bar from an item to another by drag and drop
with AxG2antt1 do
begin
	Chart.FirstVisibleDate := '1/1/2001';
	Chart.AllowLinkBars := False;
	Chart.Bars.Item['Task'].OverlaidType := Integer(EXG2ANTTLib.OverlaidBarsTypeEnum.exOverlaidBarsTransparent) Or Integer(EXG2ANTTLib.OverlaidBarsTypeEnum.exOverlaidBarsOffset);
	Columns.Add('Column');
	with Items do
	begin
		AddBar(AddItem('Item 1'),'Task','1/2/2001','1/4/2001','A',Nil);
		h := AddItem('Item 2');
		AddBar(h,'Task','1/5/2001','1/7/2001','B',Nil);
		ItemBar[h,'B',EXG2ANTTLib.ItemBarPropertyEnum.exBarCanMoveToAnother] := TObject(True);
		AddItem('Item 3');
		AddItem('Item 4');
	end;
end
|
|
782
|
Can I move a bar from an item to another
with AxG2antt1 do
begin
	Chart.FirstVisibleDate := '1/1/2001';
	Columns.Add('Column');
	with Items do
	begin
		AddBar(AddItem('Item 1'),'Task','1/2/2001','1/4/2001','A',Nil);
		h := AddItem('Item 2');
		AddBar(h,'Task','1/6/2001','1/14/2001','B',Nil);
		ItemBar[h,'B',EXG2ANTTLib.ItemBarPropertyEnum.exBarParent] := TObject(FirstVisibleItem);
	end;
end
|
|
781
|
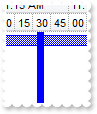
How can change the width, transparency, style, visual appearance ( EBN), of the vertical bar that shows the current date-time
with AxG2antt1 do
begin
	VisualAppearance.Add(1,'c:\exontrol\images\normal.ebn');
	with Chart do
	begin
		LevelCount := 2;
		Level[0].Label := TObject(1048576);
		with Level[1] do
		begin
			Label := '<%ss%>';
			Count := 15;
		end;
		MarkNowColor := $1000000;
		MarkNowWidth := 6;
		MarkNowTransparent := 50;
	end;
	Columns.Add('Tasks');
	with Items do
	begin
		AddBar(AddItem('Item 1'),'Task','1/1/2008','1/1/2018',Nil,Nil);
	end;
end
|
|
780
|
How can change the width, style, visual appearance ( EBN), of the vertical bar that shows the current time

with AxG2antt1 do
begin
	VisualAppearance.Add(1,'c:\exontrol\images\normal.ebn');
	with Chart do
	begin
		LevelCount := 2;
		Level[0].Label := TObject(1048576);
		with Level[1] do
		begin
			Label := '<%ss%>';
			Count := 15;
		end;
		MarkNowColor := $1000000;
		MarkNowWidth := 6;
	end;
	Columns.Add('Tasks');
	with Items do
	begin
		AddBar(AddItem('Item 1'),'Task','1/1/2008','1/1/2018',Nil,Nil);
	end;
end
|
|
779
|
How can I show a vertical bar that indicates the current time
with AxG2antt1 do
begin
	with Chart do
	begin
		LevelCount := 2;
		Level[0].Label := TObject(1048576);
		with Level[1] do
		begin
			Label := '<%ss%>';
			Count := 15;
		end;
		MarkNowColor := $ff0000;
		MarkNowWidth := 7;
	end;
	Columns.Add('Tasks');
	with Items do
	begin
		AddBar(AddItem('Item 1'),'Task','1/1/2008','1/1/2018',Nil,Nil);
	end;
end
|
|
778
|
How can I show semi-transparent the vertical bar that indicates the current time
with AxG2antt1 do
begin
	with Chart do
	begin
		LevelCount := 2;
		Level[0].Label := TObject(1048576);
		with Level[1] do
		begin
			Label := '<%ss%>';
			Count := 15;
		end;
		MarkNowColor := $ff0000;
		MarkNowWidth := 7;
		MarkNowTransparent := 50;
	end;
	Columns.Add('Tasks');
	with Items do
	begin
		AddBar(AddItem('Item 1'),'Task','1/1/2008','1/1/2018',Nil,Nil);
	end;
end
|
|
777
|
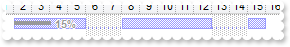
Is there any way to highlight or show a vertical bar that indicates the current time, from 15 to 15 seconds
with AxG2antt1 do
begin
	Chart.LevelCount := 2;
	Chart.Level[0].Label := TObject(1048576);
	with Chart.Level[1] do
	begin
		Label := '<%ss%>';
		Count := 15;
	end;
	Chart.MarkNowColor := $ff0000;
	Chart.MarkNowCount := 15;
	Chart.MarkNowWidth := 3;
end
|
|
776
|
Is there any way to highlight or show a vertical bar that indicates the current time, from minute to minute, hour and so on
with AxG2antt1 do
begin
	with Chart do
	begin
		UnitWidth := 48;
		LevelCount := 1;
		Level[0].Label := TObject(1048576);
		MarkNowColor := $ff;
		MarkNowUnit := EXG2ANTTLib.UnitEnum.exMinute;
		MarkNowWidth := UnitWidth;
	end;
end
|
|
775
|
Is there any way to highlight or show a vertical bar that indicates the current time
with AxG2antt1 do
begin
	Chart.LevelCount := 2;
	Chart.Level[0].Label := TObject(1048576);
	with Chart.Level[1] do
	begin
		Label := '<%ss%>';
		Count := 15;
	end;
	Chart.MarkNowColor := $ff;
end
|
|
774
|
Is there a way of making a bar flash on the screen
with AxG2antt1 do
begin
Columns.Add('Task');
Chart.FirstVisibleDate := '1/1/2001';
with Items do
begin
h := AddItem('Flashy task');
AddBar(h,'Task','1/2/2001','1/6/2001','K1',Nil);
ItemBar[h,'K1',EXG2ANTTLib.ItemBarPropertyEnum.exBarTransparent] := TObject(80);
end;
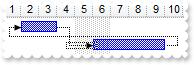
end
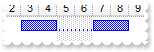
|
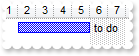
|
773
|
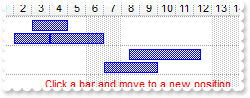
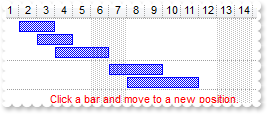
Is there any option to display overlay bars as a stack, or bars that laid over or cover other bars (exOverlaidBarsStackAutoArrange)
with AxG2antt1 do
begin
BeginUpdate();
ScrollBySingleLine := True;
Columns.Add('Task');
DrawGridLines := EXG2ANTTLib.GridLinesEnum.exHLines;
with Chart do
begin
DrawGridLines := EXG2ANTTLib.GridLinesEnum.exHLines;
AllowCreateBar := EXG2ANTTLib.CreateBarEnum.exCreateBarAuto;
AllowLinkBars := False;
ResizeUnitScale := EXG2ANTTLib.UnitEnum.exHour;
PaneWidth[False] := 48;
FirstVisibleDate := '1/1/2001';
with Bars.Item['Task'] do
begin
OverlaidType := Integer(EXG2ANTTLib.OverlaidBarsTypeEnum.exOverlaidBarsStackAutoArrange) Or Integer(EXG2ANTTLib.OverlaidBarsTypeEnum.exOverlaidBarsStack);
Overlaid[EXG2ANTTLib.OverlaidBarsTypeEnum.exOverlaidBarsTransparent] := TObject(80);
end;
end;
with Items do
begin
h := AddItem('Task 1');
AddBar(h,'Task','1/2/2001','1/4/2001','A1',Nil);
AddBar(h,'Task','1/3/2001','1/5/2001','A2',Nil);
AddBar(h,'Task','1/4/2001','1/7/2001','A3',Nil);
h := AddItem('Task 2');
AddBar(h,'Task','1/7/2001','1/10/2001','A1',Nil);
AddBar(h,'Task','1/8/2001','1/12/2001','A3',Nil);
h := AddItem(Nil);
SelectableItem[h] := False;
AddBar(h,'','1/7/2001','1/11/2001',Nil,'<fgcolor=FF0000>Click a bar and move to a new position.');
end;
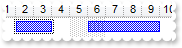
EndUpdate();
end
|
|
772
|
Is there any option to display overlay bars as a stack, or bars that laid over or cover other bars (overlay)
with AxG2antt1 do
begin
	BeginUpdate();
	ScrollBySingleLine := True;
	Columns.Add('Task');
	DrawGridLines := EXG2ANTTLib.GridLinesEnum.exHLines;
	with Chart do
	begin
		DrawGridLines := EXG2ANTTLib.GridLinesEnum.exHLines;
		AllowCreateBar := EXG2ANTTLib.CreateBarEnum.exCreateBarAuto;
		AllowLinkBars := False;
		ResizeUnitScale := EXG2ANTTLib.UnitEnum.exHour;
		PaneWidth[False] := 48;
		FirstVisibleDate := '1/1/2001';
		Bars.Item['Task'].OverlaidType := EXG2ANTTLib.OverlaidBarsTypeEnum.exOverlaidBarsStack;
	end;
	with Items do
	begin
		h := AddItem('Task 1');
		AddBar(h,'Task','1/2/2001','1/4/2001','A1',Nil);
		AddBar(h,'Task','1/3/2001','1/5/2001','A2',Nil);
		AddBar(h,'Task','1/4/2001','1/7/2001','A3',Nil);
		h := AddItem('Task 2');
		AddBar(h,'Task','1/7/2001','1/10/2001','A1',Nil);
		AddBar(h,'Task','1/8/2001','1/12/2001','A3',Nil);
		h := AddItem(Nil);
		SelectableItem[h] := False;
		AddBar(h,'','1/7/2001','1/11/2001',Nil,'<fgcolor=FF0000>Click a bar and move to a new position.');
	end;
	EndUpdate();
end
|
|
771
|
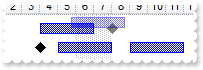
Does the overlay also work in milestone bars
with AxG2antt1 do
begin
	BeginUpdate();
	DefaultItemHeight := 22;
	Columns.Add('Task');
	with Chart do
	begin
		ResizeUnitScale := EXG2ANTTLib.UnitEnum.exHour;
		PaneWidth[False] := 48;
		FirstVisibleDate := '1/1/2001';
		with Bars do
		begin
			with Item['Task'] do
			begin
				OverlaidType := Integer(EXG2ANTTLib.OverlaidBarsTypeEnum.exOverlaidBarsTransparent) Or Integer(EXG2ANTTLib.OverlaidBarsTypeEnum.exOverlaidBarsOffset);
				OverlaidGroup := 'Milestone';
			end;
			with Item['Milestone'] do
			begin
				OverlaidType := Integer(EXG2ANTTLib.OverlaidBarsTypeEnum.exOverlaidBarsTransparent) Or Integer(EXG2ANTTLib.OverlaidBarsTypeEnum.exOverlaidBarsOffset);
				OverlaidGroup := 'Task';
			end;
		end;
	end;
	with Items do
	begin
		h := AddItem('Task 1');
		AddBar(h,'Task','1/4/2001','1/7/2001','A1',Nil);
		AddBar(h,'Milestone','1/8/2001','1/8/2001','M',Nil);
		AddBar(h,'Task','1/9/2001','1/12/2001','A3',Nil);
		h := AddItem('Task 2');
		AddBar(h,'Milestone','1/4/2001','1/4/2001','M',Nil);
		AddBar(h,'Task','1/5/2001','1/8/2001','A1',Nil);
		AddBar(h,'Task','1/9/2001','1/12/2001','A3',Nil);
		h := AddItem(Nil);
		SelectableItem[h] := False;
		AddBar(h,'','1/7/2001','1/11/2001',Nil,'<fgcolor=FF0000>Click a bar and move to a new position.');
	end;
	EndUpdate();
end
|
|
770
|
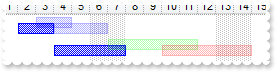
Is there any option to display overlaid bars of different types, or bars that laid over or cover other bars (overlay)
with AxG2antt1 do
begin
	DefaultItemHeight := 22;
	Columns.Add('Task');
	with Chart do
	begin
		ResizeUnitScale := EXG2ANTTLib.UnitEnum.exHour;
		PaneWidth[False] := 48;
		FirstVisibleDate := '1/1/2001';
		with Bars do
		begin
			Copy('Task','RTask').Color := $ff;
			Copy('Task','GTask').Color := $ff00;
			with Item['Task'] do
			begin
				OverlaidType := Integer(EXG2ANTTLib.OverlaidBarsTypeEnum.exOverlaidBarsTransparent) Or Integer(EXG2ANTTLib.OverlaidBarsTypeEnum.exOverlaidBarsOffset);
				Overlaid[EXG2ANTTLib.OverlaidBarsTypeEnum.exOverlaidBarsTransparent] := TObject(70);
				OverlaidGroup := 'RTask,GTask';
			end;
		end;
	end;
	with Items do
	begin
		h := AddItem('Task 1');
		AddBar(h,'Task','1/2/2001','1/4/2001','A1',Nil);
		AddBar(h,'Task','1/3/2001','1/5/2001','A2',Nil);
		AddBar(h,'Task','1/4/2001','1/7/2001','A3',Nil);
		h := AddItem('Task 2');
		AddBar(h,'Task','1/4/2001','1/8/2001','A1',Nil);
		AddBar(h,'GTask','1/7/2001','1/12/2001','A2',Nil);
		AddBar(h,'RTask','1/10/2001','1/15/2001','A3',Nil);
		h := AddItem(Nil);
		SelectableItem[h] := False;
		AddBar(h,'','1/7/2001','1/11/2001',Nil,'<fgcolor=FF0000>Click a bar and move to a new position.');
	end;
end
|
|
769
|
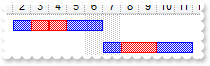
Is there any option to display overlaid bars, or bars that laid over or cover other bars (overlay)
with AxG2antt1 do
begin
	DefaultItemHeight := 22;
	Columns.Add('Task');
	with Chart do
	begin
		ResizeUnitScale := EXG2ANTTLib.UnitEnum.exHour;
		PaneWidth[False] := 48;
		FirstVisibleDate := '1/1/2001';
		with Bars do
		begin
			with Copy('Task','BTask') do
			begin
				Color := $ff;
			end;
			with Item['Task'] do
			begin
				OverlaidType := EXG2ANTTLib.OverlaidBarsTypeEnum.exOverlaidBarsIntersect;
				Overlaid[EXG2ANTTLib.OverlaidBarsTypeEnum.exOverlaidBarsIntersect] := 'BTask';
			end;
		end;
	end;
	with Items do
	begin
		h := AddItem('Task 1');
		AddBar(h,'Task','1/2/2001','1/4/2001','A1',Nil);
		AddBar(h,'Task','1/3/2001','1/5/2001','A2',Nil);
		AddBar(h,'Task','1/4/2001','1/7/2001','A3',Nil);
		h := AddItem('Task 2');
		AddBar(h,'Task','1/7/2001','1/10/2001','A1',Nil);
		AddBar(h,'Task','1/8/2001','1/12/2001','A3',Nil);
		h := AddItem(Nil);
		SelectableItem[h] := False;
		AddBar(h,'','1/7/2001','1/11/2001',Nil,'<fgcolor=FF0000>Click a bar and move to a new position.');
	end;
end
|
|
768
|
Is there any option to display overlaid bars, or bars that laid over or cover other bars (overlay)
with AxG2antt1 do
begin
	DefaultItemHeight := 22;
	Columns.Add('Task');
	with Chart do
	begin
		ResizeUnitScale := EXG2ANTTLib.UnitEnum.exHour;
		PaneWidth[False] := 48;
		FirstVisibleDate := '1/1/2001';
		with Bars.Item['Task'] do
		begin
			OverlaidType := Integer(EXG2ANTTLib.OverlaidBarsTypeEnum.exOverlaidBarsTransparent) Or Integer(EXG2ANTTLib.OverlaidBarsTypeEnum.exOverlaidBarsOffset);
			Overlaid[EXG2ANTTLib.OverlaidBarsTypeEnum.exOverlaidBarsTransparent] := TObject(70);
		end;
	end;
	with Items do
	begin
		h := AddItem('Task 1');
		AddBar(h,'Task','1/2/2001','1/4/2001','A1',Nil);
		AddBar(h,'Task','1/3/2001','1/5/2001','A2',Nil);
		AddBar(h,'Task','1/4/2001','1/7/2001','A3',Nil);
		h := AddItem('Task 2');
		AddBar(h,'Task','1/7/2001','1/10/2001','A1',Nil);
		AddBar(h,'Task','1/8/2001','1/12/2001','A3',Nil);
		h := AddItem(Nil);
		SelectableItem[h] := False;
		AddBar(h,'','1/7/2001','1/11/2001',Nil,'<fgcolor=FF0000>Click a bar and move to a new position.');
	end;
end
|
|
767
|
Is there any option to display overlaid bars, or bars that laid over or cover other bars (overlay)
with AxG2antt1 do
begin
	DefaultItemHeight := 22;
	Columns.Add('Task');
	with Chart do
	begin
		ResizeUnitScale := EXG2ANTTLib.UnitEnum.exHour;
		PaneWidth[False] := 48;
		FirstVisibleDate := '1/1/2001';
		Bars.Item['Task'].OverlaidType := EXG2ANTTLib.OverlaidBarsTypeEnum.exOverlaidBarsOffset;
	end;
	with Items do
	begin
		h := AddItem('Task 1');
		AddBar(h,'Task','1/2/2001','1/4/2001','A1',Nil);
		AddBar(h,'Task','1/3/2001','1/5/2001','A2',Nil);
		AddBar(h,'Task','1/4/2001','1/7/2001','A3',Nil);
		h := AddItem('Task 2');
		AddBar(h,'Task','1/7/2001','1/10/2001','A1',Nil);
		AddBar(h,'Task','1/8/2001','1/12/2001','A3',Nil);
		h := AddItem(Nil);
		SelectableItem[h] := False;
		AddBar(h,'','1/7/2001','1/11/2001',Nil,'<fgcolor=FF0000>Click a bar and move to a new position.');
	end;
end
|
|
766
|
How can include the values in the inner cells in the drop down filter window
with AxG2antt1 do
begin
	DrawGridLines := EXG2ANTTLib.GridLinesEnum.exRowLines;
	VisualAppearance.Add(1,'c:\exontrol\images\normal.ebn');
	set_Description(EXG2ANTTLib.DescriptionTypeEnum.exFilterBarBlanks,'');
	set_Description(EXG2ANTTLib.DescriptionTypeEnum.exFilterBarNonBlanks,'');
	with (Columns.Add('Single Column') as EXG2ANTTLib.Column) do
	begin
		HTMLCaption := 'Single column with <b>inner cells</b>';
		ToolTip := 'Click the drop down filter button, and the filter list includes the inner cells values too.';
		DisplayFilterButton := True;
		DisplayFilterPattern := False;
		FilterList := EXG2ANTTLib.FilterListEnum.exIncludeInnerCells;
	end;
	ShowFocusRect := False;
	with Items do
	begin
		s := SplitCell[TObject(AddItem('S 1.1')),TObject(0)];
		CellValue[Nil,TObject(s)] := 'S 1.2';
		CellHAlignment[Nil,TObject(s)] := EXG2ANTTLib.AlignmentEnum.CenterAlignment;
		CellBackColor[Nil,TObject(s)] := $1000000;
		CellWidth[Nil,TObject(s)] := 84;
		s := SplitCell[TObject(AddItem('S 2.1')),TObject(0)];
		CellValue[Nil,TObject(s)] := 'S 2.2';
		CellHAlignment[Nil,TObject(s)] := EXG2ANTTLib.AlignmentEnum.CenterAlignment;
		CellWidth[Nil,TObject(s)] := 84;
		s := SplitCell[TObject(AddItem('S 3.1')),TObject(0)];
		CellValue[Nil,TObject(s)] := 'S 3.2';
		CellHAlignment[Nil,TObject(s)] := EXG2ANTTLib.AlignmentEnum.CenterAlignment;
		CellBackColor[Nil,TObject(s)] := $1000000;
		CellWidth[Nil,TObject(s)] := 84;
	end;
end
|
|
765
|
How can I sort the value gets listed in the drop down filter window
with AxG2antt1 do
begin
	LinesAtRoot := EXG2ANTTLib.LinesAtRootEnum.exLinesAtRoot;
	MarkSearchColumn := False;
	set_Description(EXG2ANTTLib.DescriptionTypeEnum.exFilterBarAll,'');
	set_Description(EXG2ANTTLib.DescriptionTypeEnum.exFilterBarBlanks,'');
	set_Description(EXG2ANTTLib.DescriptionTypeEnum.exFilterBarNonBlanks,'');
	with (Columns.Add('P1') as EXG2ANTTLib.Column) do
	begin
		DisplayFilterButton := True;
		DisplayFilterPattern := False;
		FilterList := EXG2ANTTLib.FilterListEnum.exSortItemsDesc;
	end;
	with (Columns.Add('P2') as EXG2ANTTLib.Column) do
	begin
		DisplayFilterButton := True;
		DisplayFilterPattern := False;
		FilterList := EXG2ANTTLib.FilterListEnum.exSortItemsAsc;
	end;
	with Items do
	begin
		h := AddItem('Z3');
		CellValue[TObject(h),TObject(1)] := 'C';
		CellValue[TObject(InsertItem(h,Nil,'Z1')),TObject(1)] := 'B';
		CellValue[TObject(InsertItem(h,Nil,'Z2')),TObject(1)] := 'A';
		ExpandItem[h] := True;
	end;
end
|
|
764
|
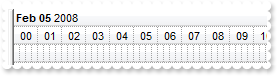
Is there a way to break the hours into 15 minute increments just showing lines instead of the minute numbers
with AxG2antt1 do
begin
	BeginUpdate();
	Chart.FirstVisibleDate := '2/5/2008';
	Chart.LevelCount := 3;
	Chart.Level[0].Label := '<b><%mmm%> <%dd%></b> <%yyyy%> ';
	with Chart.Level[1] do
	begin
		Label := '<%hh%>';
		Alignment := EXG2ANTTLib.AlignmentEnum.CenterAlignment;
	end;
	with Chart.Level[2] do
	begin
		Label := '';
		Unit := EXG2ANTTLib.UnitEnum.exMinute;
		Count := 15;
	end;
	Chart.UnitWidth := 6;
	EndUpdate();
end
|
|
763
|
How do I specify a range where the bar can be moved or resized and to highlight the range
with AxG2antt1 do
begin
	BeginUpdate();
	VisualAppearance.Add(1,'c:\exontrol\images\normal.ebn');
	Chart.FirstVisibleDate := '1/1/2001';
	Chart.ScrollRange[EXG2ANTTLib.ScrollRangeEnum.exStartDate] := '1/1/2001';
	Chart.ScrollRange[EXG2ANTTLib.ScrollRangeEnum.exEndDate] := '1/7/2001';
	Chart.PaneWidth[False] := 128;
	Columns.Add('Column');
	with Items do
	begin
		h := AddItem('Item 1');
		AddBar(h,'Task','1/1/2001','1/4/2001',Nil,Nil);
		ItemBar[h,'',EXG2ANTTLib.ItemBarPropertyEnum.exBarMinStart] := '1/2/2001';
		ItemBar[h,'',EXG2ANTTLib.ItemBarPropertyEnum.exBarMaxEnd] := '1/8/2001';
		ItemBar[h,'',EXG2ANTTLib.ItemBarPropertyEnum.exBarShowRange] := TObject(16777216);
		ItemBar[h,'',EXG2ANTTLib.ItemBarPropertyEnum.exBarShowRangeTransparent] := TObject(60);
		h := AddItem('Item 2');
		AddBar(h,'Task','1/1/2001','1/4/2001',Nil,Nil);
	end;
	EndUpdate();
end
|
|
762
|
How do I specify a range where the bar can be moved or resized and to highlight the range
with AxG2antt1 do
begin
	BeginUpdate();
	Chart.FirstVisibleDate := '1/1/2001';
	Chart.ScrollRange[EXG2ANTTLib.ScrollRangeEnum.exStartDate] := '1/1/2001';
	Chart.ScrollRange[EXG2ANTTLib.ScrollRangeEnum.exEndDate] := '1/7/2001';
	Chart.PaneWidth[False] := 128;
	Columns.Add('Column');
	with Items do
	begin
		h := AddItem('Item 1');
		AddBar(h,'Task','1/1/2001','1/4/2001',Nil,Nil);
		ItemBar[h,'',EXG2ANTTLib.ItemBarPropertyEnum.exBarMinStart] := '1/2/2001';
		ItemBar[h,'',EXG2ANTTLib.ItemBarPropertyEnum.exBarMaxEnd] := '1/8/2001';
		ItemBar[h,'',EXG2ANTTLib.ItemBarPropertyEnum.exBarShowRange] := TObject(32);
		ItemBar[h,'',EXG2ANTTLib.ItemBarPropertyEnum.exBarShowRangeTransparent] := TObject(90);
		h := AddItem('Item 2');
		AddBar(h,'Task','1/1/2001','1/4/2001',Nil,Nil);
	end;
	EndUpdate();
end
|
|
761
|
How do I specify a range where the bar can be moved or resized and to highlight the range
with AxG2antt1 do
begin
	BeginUpdate();
	Chart.FirstVisibleDate := '1/1/2001';
	Chart.ScrollRange[EXG2ANTTLib.ScrollRangeEnum.exStartDate] := '1/1/2001';
	Chart.ScrollRange[EXG2ANTTLib.ScrollRangeEnum.exEndDate] := '1/7/2001';
	Chart.PaneWidth[False] := 128;
	Columns.Add('Column');
	with Items do
	begin
		h := AddItem('Item 1');
		AddBar(h,'Task','1/1/2001','1/4/2001',Nil,Nil);
		ItemBar[h,'',EXG2ANTTLib.ItemBarPropertyEnum.exBarMinStart] := '1/2/2001';
		ItemBar[h,'',EXG2ANTTLib.ItemBarPropertyEnum.exBarMaxEnd] := '1/8/2001';
		ItemBar[h,'',EXG2ANTTLib.ItemBarPropertyEnum.exBarShowRange] := TObject(65286);
		ItemBar[h,'',EXG2ANTTLib.ItemBarPropertyEnum.exBarShowRangeTransparent] := TObject(90);
		h := AddItem('Item 2');
		AddBar(h,'Task','1/1/2001','1/4/2001',Nil,Nil);
	end;
	EndUpdate();
end
|
|
760
|
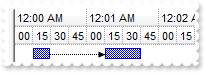
How do I specify a range where the bar can be moved or resized
with AxG2antt1 do
begin
	BeginUpdate();
	Chart.FirstVisibleDate := '1/1/2001';
	Chart.ScrollRange[EXG2ANTTLib.ScrollRangeEnum.exStartDate] := '1/1/2001';
	Chart.ScrollRange[EXG2ANTTLib.ScrollRangeEnum.exEndDate] := '1/7/2001';
	Chart.PaneWidth[False] := 128;
	Columns.Add('Column');
	with Items do
	begin
		h := AddItem('Item 1');
		AddBar(h,'Task','1/1/2001','1/4/2001',Nil,Nil);
		ItemBar[h,'',EXG2ANTTLib.ItemBarPropertyEnum.exBarMinStart] := '1/2/2001';
		ItemBar[h,'',EXG2ANTTLib.ItemBarPropertyEnum.exBarMaxEnd] := '1/8/2001';
		h := AddItem('Item 2');
		AddBar(h,'Task','1/1/2001','1/4/2001',Nil,Nil);
	end;
	EndUpdate();
end
|
|
759
|
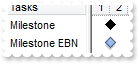
How can I change the visual appearance of the milestone bar using EBN
with AxG2antt1 do
begin
	with VisualAppearance do
	begin
		Add(1,'gBFLBCJwBAEHhEJAEGg4BKMMQAAYAQGKIYBkAKBQAGaAoDDMMILQiMQwjRBMKgBBCLIxiGK4DhiF4aRTHUKAAKQahLEaSZLhEZRQiqA4sS5FQBSBDQFwSByEY6mSaYJA' +
	'WK4tCyNM7SfQAbxnAgYaLAAYRUjuHZOTZAc4UfAdFL/K4AKrfeZIeAiCRQGiYZyHKaRShjDwXKLIIjbJhkNoJChCNQgBScPgxCx8JypaCaar2fjQM6zWAMdb2Cz7PjDH' +
	'7wPA1WYJRaDYjhcB4LheAqGXBWUYLYb8XS3EKJYhiWA4HjqFjGJpcEzPbRiNx3H6SABlLLaLo7JpGO52FrTHZjXyzLqBVpoOyEbrmcozYzjN41RpWETfQYDcwteqcLpr' +
	'hGVZrm6dp8j4bAnDQP5Uh+OpcH6R4Lg2YJvEIeg6kWEoJB2ZZyG6GoLCSXxtG+IZ1GmfhJjcawNFWfB/h+V5pnUc5VhWeZ4BMX4jlySwtiAJodlEYRaBYFgHHgIA2gGE' +
	'xkFUdxFl6A5hgUbgXgcVRzFiXA3CICARAEgI');
		Add(2,'CP:1 -6 0 5 0');
	end;
	with Chart do
	begin
		FirstVisibleDate := '1/1/2001';
		with Bars.Add('MilestoneEBN') do
		begin
			Color := $2000000;
			Height := 14;
		end;
	end;
	Columns.Add('Tasks');
	with Items do
	begin
		AddBar(AddItem('Milestone'),'Milestone','1/2/2001','1/2/2001 12:00:01 AM',Nil,Nil);
		AddBar(AddItem('Milestone EBN '),'MilestoneEBN','1/2/2001','1/2/2001 12:00:01 AM',Nil,Nil);
	end;
end
|
|
758
|
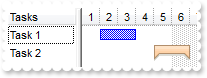
How can I change the visual appearance of the summary bar using EBN
with AxG2antt1 do
begin
	VisualAppearance.Add(1,'gBFLBCJwBAEHhEJAEGg4BGICg6AADACAxRDAMgBQKAAzQFAYZhhBaERiGEaIJhUAIIRZGMQxXAcMQvDSKQJhGDAADEMgyAJCIxjPIgZBoGqPBpASQJUhkMocR7HMygBI' +
	'kSRNA8kMwxdQEaw9ECRIDpGaYWTFDhsABTVQRLL0Tw9ISERqoSSaGgkCYaA7CNJ0PBNJSjJ6LJZGURbKqyCQ1DBbUB3BaUaQ9JaKa7pKa7cpWKIqSxEMrxcLFcT5DSbY' +
	'DxGjLEhmPZBVZQNBxtJbFQHWJCNgzVAdOAAfzQM70GpMQoWJYeVpEObSBD1dABTCBczADYoex7ID+aJuGiYVZdWxJOjfbhkTTIJAaCawABrWxR8iHN5paTnUpzDjwbg0' +
	'kqRRyr+XwjA8Go/HSBp6g6KJTFcGpWmYdg8H6dJTH0EZelueBfBuLwyBMd50nIfR+kmXB4BECQUAaEYMHQHRHCGFRYI2ZAwEIExghQZA2EIQoGGoEhOgGBBYlAeYYHMW' +
	'JcDcGx4HYHoHmICIFjeBohkaDAAC2DAjBYJIIiKSI2CSC5hjQJBsCOCwYiIKoGmKWJkn6DANkiWgzCwYwolAcQkksWJaCuDohlicg2hDQR+EELBInKcJohMJBomILoGm' +
	'ISQuESFBOgkOQDg+SoTEyfoXCUSImDyGZhjkaI1hcJgTnoXgACYCYKG2GQkEkVJchKIoZDIbIciYKY+HEP4mlmThSg+aBIlKBYUCUKgGHyG4jEkPoKiAKI6D6EokGkSg' +
	'yECF5jEKVJZD+aYqHKG4nGoCh+iKJ4qEqBokh+KYag6JoqmqKo2iWJpqgKRJHDiT5qk6NYtCsapmjiLprHqdo6i8awan6QovCwOp6kSLQsBsHpGjKbBbBaMYhm0CgalI' +
	'LBtBsUpTiGUIUAQgIA==');
	with Chart do
	begin
		FirstVisibleDate := '1/1/2001';
		with Bars.Copy('Task','Summary') do
		begin
			Color := $1000000;
			Height := 16;
		end;
	end;
	Columns.Add('Tasks');
	with Items do
	begin
		AddBar(AddItem('Task 1'),'Task','1/2/2001','1/4/2001',Nil,Nil);
		AddBar(AddItem('Task 2'),'Summary','1/5/2001','1/7/2001',Nil,Nil);
	end;
end
|
|
757
|
How can I change the visual appearance of the task bar using EBN
with AxG2antt1 do
begin
	VisualAppearance.Add(1,'gBFLBCJwBAEHhEJAEGg4BGoCg6AADACAxRDAMgBQKAAzQFAYZhhBaERiGEaIJhUAIIRZGMQxXAcMQvDSKQJhGLhQiSJoJDSBEgSXDIZQ5D6OZYACDJQACJYJTbAYzyPJ' +
	'kPRAA6EZCmGAwCglf5HABRb7xNLkbQ8GySKJnWCQJhoD5BSLCNRUTRFFQtGgZBpEWwLCjQNQwWLKFoTJIEPSBDKqYDoKYqTgOOZOThHQz3HakQRdAa/ZpnaKpUo2d47X' +
	'jMWBwGA0EzeAAGaxoShqdoiFaGU7UOJVJBOGwHK6BchoMAKbp6XoVWRaOAWLZWVABM7XLZxbLccyGfZ1XhdV5UbqUMznR7PNrjLKIJpCOJbbyAFwgBaeQABYLhK7iHRm' +
	'i8XYwjMWpjFWOx1GIB5LmgdB4HCEBECSIBpDGHQOicIwokYPImikEIJj6eJIloEgogSc40FGcJEFiYZIG2VIoAURw1g2QxyAQNwNAMPJOgIYI4CoDIBmAeAKBIUpQDUK' +
	'JYDoTpIB4vxgmgdgNgeYZDDoFw7CEJhQn+BohmKfImCWSZRlgYwikYMQ0gwF4DniTA/gwBJYjQYwsgoIg6AyCRQDiIJODAZBImoOguAmMZ4lQLIJjOMI3CYZJpEIT4Ki' +
	'KSI6DqD5ZGAAgHC2DAjBYR4SGUGYGE+GIlCmFhRhIB5iFAbwWsiJgMhoCoxngV4ZCcSYOHaGYnHmIg8COJpoCoOISmSWZeHWHgoEkRoAg4EIYB4NogmiSgKg6GRjGoJg' +
	'Fh+ZJKDaBYjmgaQygiBRUHmbhoDsTAyiqIIoioGoOw8aoKhKKoemeOIaAeF5HmqHoqiyKxKgYaN/locgBiuZRojoVIok8cwsjaMBLGqDoAhGIpoEYWYEmAIxUkQLZmgi' +
	'Yg2g2I4JiCQwuAqWIOIkEAQICA==');
	with Chart do
	begin
		FirstVisibleDate := '1/1/2001';
		with Bars.Item['Task'] do
		begin
			Color := $1000000;
			Height := 16;
		end;
	end;
	Columns.Add('Tasks');
	with Items do
	begin
		AddBar(AddItem('Task 1'),'Task','1/2/2001','1/4/2001',Nil,Nil);
		AddBar(AddItem('Task 2'),'Task','1/5/2001','1/7/2001',Nil,Nil);
	end;
end
|
|
756
|
How can I change the visual appearance of the task bar using EBN
with AxG2antt1 do
begin
	VisualAppearance.Add(1,'gBFLBCJwBAEHhEJAEGg4BZsIQAAYAQGKIYBkAKBQAGaAoDDMMILQiMQwjRBMKgBBCLIxiGK4DhiGoZATCMbDBIcSwSGgCJCjeS4ZDKHIXSxFUKTBAcSQTGyBRokaYZRi' +
	'6A4+TRPETTWAEcABHSbQCoKTKAoCHpLQLMYxDKItJSpGYaRgqWCaZpuUIaUzKVbxbK9CSMGiQbIsOJrBqqQozWZHVITLR9VgBNqga7uGR5DoqdovU5dVTVda9Ly5LSsM' +
	'QvfALCqOe45URdNp3RiVBYfI6+cZvfJLWh4NqeAbCMC1UJoYhlUKCBg0TRoVo9AIDX5QWaYXC0AkBA==');
	with Chart do
	begin
		FirstVisibleDate := '1/1/2001';
		with Bars.Item['Task'] do
		begin
			Color := $1000000;
			Height := 16;
		end;
	end;
	Columns.Add('Tasks');
	with Items do
	begin
		AddBar(AddItem('Task 1'),'Task','1/2/2001','1/4/2001',Nil,Nil);
		AddBar(AddItem('Task 2'),'Task','1/5/2001','1/7/2001',Nil,Nil);
	end;
end
|
|
755
|
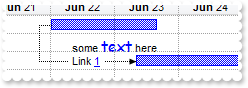
Is there any way to change the units and count of units used in resizing or moving a bar
with AxG2antt1 do
begin
	BeginUpdate();
	Columns.Add('Task');
	with Chart do
	begin
		AllowCreateBar := EXG2ANTTLib.CreateBarEnum.exNoCreateBar;
		DrawGridLines := EXG2ANTTLib.GridLinesEnum.exAllLines;
		PaneWidth[False] := 64;
		FirstVisibleDate := '6/21/2005';
		ResizeUnitScale := EXG2ANTTLib.UnitEnum.exHour;
		ResizeUnitCount := 8;
		UnitWidth := 64;
		with Level[0] do
		begin
			Label := '<b><%mmm%></b> <%dd%>';
			DrawGridLines := True;
		end;
	end;
	with Items do
	begin
		h := AddItem('Root');
		AddBar(h,'Task','6/22/2005','6/23/2005 4:00:00 PM',Nil,Nil);
		h1 := InsertItem(h,Nil,'Task 1');
		AddBar(h1,'','6/22/2005','6/24/2005',Nil,'some <font Comic Sans MS;12><a>text</a></font> here');
		h1 := InsertItem(h,Nil,'Task 2');
		AddBar(h1,'Task','6/23/2005 8:00:00 AM','6/28/2005',Nil,Nil);
		AddLink('Link1',h,'',h1,'');
		Link['Link1',EXG2ANTTLib.LinkPropertyEnum.exLinkStartPos] := TObject(0);
		Link['Link1',EXG2ANTTLib.LinkPropertyEnum.exLinkText] := '<bgcolor=FFFFFF> Link <a>1</a> </bgcolor>';
		ExpandItem[h] := True;
	end;
	EndUpdate();
end
|
|
754
|
When trying to resize, move or create a bar, it appears that you can only resize, move or create it in the units that were specified for the level in the timeline. Is there any way to change the units used in resizing or moving a bar
with AxG2antt1 do
begin
	BeginUpdate();
	Columns.Add('Task');
	with Chart do
	begin
		AllowCreateBar := EXG2ANTTLib.CreateBarEnum.exNoCreateBar;
		PaneWidth[False] := 64;
		FirstVisibleDate := '6/21/2005';
		ResizeUnitScale := EXG2ANTTLib.UnitEnum.exHour;
		UnitWidth := 64;
		Level[0].Label := '<b><%mmm%></b> <%dd%>';
	end;
	with Items do
	begin
		h := AddItem('Root');
		AddBar(h,'Task','6/22/2005','6/23/2005 4:00:00 PM',Nil,Nil);
		h1 := InsertItem(h,Nil,'Task 1');
		AddBar(h1,'','6/22/2005','6/24/2005',Nil,'some <font Comic Sans MS;12><a>text</a></font> here');
		h1 := InsertItem(h,Nil,'Task 2');
		AddBar(h1,'Task','6/23/2005 8:00:00 AM','6/28/2005',Nil,Nil);
		AddLink('Link1',h,'',h1,'');
		Link['Link1',EXG2ANTTLib.LinkPropertyEnum.exLinkStartPos] := TObject(0);
		Link['Link1',EXG2ANTTLib.LinkPropertyEnum.exLinkText] := '<bgcolor=FFFFFF> Link <a>1</a> </bgcolor>';
		ExpandItem[h] := True;
	end;
	EndUpdate();
end
|
|
753
|
How can I clip the HTML text or caption inside the bar
with AxG2antt1 do
begin
	Columns.Add('Task');
	Chart.FirstVisibleDate := '1/1/2001';
	with Chart.Bars.Item['Task'] do
	begin
		Pattern := EXG2ANTTLib.PatternEnum.exPatternBox;
		Height := 13;
	end;
	with Items do
	begin
		h := AddItem('Task 1');
		AddBar(h,'Task','1/2/2001','1/6/2001','K1','This is a bit of text that get''s clipped');
		ItemBar[h,'K1',EXG2ANTTLib.ItemBarPropertyEnum.exBarHAlignCaption] := TObject(3);
	end;
end
|
|
752
|
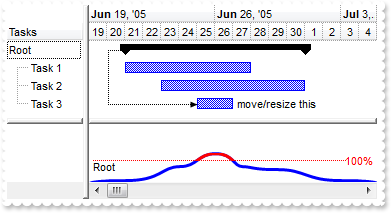
How to show the overallocation/workload histogram
with AxG2antt1 do
begin
	BeginUpdate();
	Columns.Add('Tasks');
	with Chart do
	begin
		LevelCount := 2;
		NonworkingDays := 0;
		PaneWidth[False] := 70;
		FirstVisibleDate := '6/20/2005';
		HistogramVisible := True;
		HistogramHeight := 64;
		with Bars.Item['Task'] do
		begin
			HistogramCriticalColor := $ff;
			HistogramPattern := EXG2ANTTLib.PatternEnum.exBezierCurve;
			HistogramType := EXG2ANTTLib.HistogramTypeEnum.exHistOverAllocation;
		end;
	end;
	with Items do
	begin
		h := AddItem('Root');
		AddBar(h,'Summary','6/21/2005','7/1/2005',Nil,Nil);
		h1 := InsertItem(h,Nil,'Task 1');
		AddBar(h1,'Task','6/21/2005','6/28/2005',Nil,Nil);
		h1 := InsertItem(h,Nil,'Task 2');
		AddBar(h1,'Task','6/23/2005','7/1/2005','E',Nil);
		ItemBar[h1,'E',EXG2ANTTLib.ItemBarPropertyEnum.exBarEffort] := TObject(5);
		h1 := InsertItem(h,Nil,'Task 3');
		AddBar(h1,'Task','6/25/2005','6/27/2005','E',Nil);
		ItemBar[h1,'E',EXG2ANTTLib.ItemBarPropertyEnum.exBarEffort] := TObject(2);
		ItemBar[h1,'E',EXG2ANTTLib.ItemBarPropertyEnum.exBarCaption] := 'move/resize this';
		ItemBar[h1,'E',EXG2ANTTLib.ItemBarPropertyEnum.exBarHAlignCaption] := TObject(18);
		ItemBar[h1,'E',EXG2ANTTLib.ItemBarPropertyEnum.exBarToolTip] := 'Click the bar and move or resize it. The histogram-graph will be updated.';
		AddLink('Link1',h,'',h1,'E');
		Link['Link1',EXG2ANTTLib.LinkPropertyEnum.exLinkStartPos] := TObject(0);
		ExpandItem[h] := True;
	end;
	EndUpdate();
end
|
|
751
|
How to show the overload histogram
with AxG2antt1 do
begin
	BeginUpdate();
	Columns.Add('Tasks');
	with Chart do
	begin
		LevelCount := 2;
		NonworkingDays := 0;
		PaneWidth[False] := 70;
		FirstVisibleDate := '6/20/2005';
		HistogramVisible := True;
		HistogramHeight := 64;
		with Bars.Item['Task'] do
		begin
			HistogramPattern := EXG2ANTTLib.PatternEnum($100 Or Integer(EXG2ANTTLib.PatternEnum.exPatternDot));
			HistogramType := EXG2ANTTLib.HistogramTypeEnum.exHistOverload;
		end;
	end;
	with Items do
	begin
		h := AddItem('Root');
		AddBar(h,'Summary','6/21/2005','7/1/2005',Nil,Nil);
		h1 := InsertItem(h,Nil,'Task 1');
		AddBar(h1,'Task','6/21/2005','6/28/2005',Nil,Nil);
		h1 := InsertItem(h,Nil,'Task 2');
		AddBar(h1,'Task','6/23/2005','7/1/2005','E',Nil);
		ItemBar[h1,'E',EXG2ANTTLib.ItemBarPropertyEnum.exBarEffort] := TObject(5);
		h1 := InsertItem(h,Nil,'Task 3');
		AddBar(h1,'Task','6/25/2005','6/27/2005','E',Nil);
		ItemBar[h1,'E',EXG2ANTTLib.ItemBarPropertyEnum.exBarEffort] := TObject(2);
		ItemBar[h1,'E',EXG2ANTTLib.ItemBarPropertyEnum.exBarCaption] := 'move/resize this';
		ItemBar[h1,'E',EXG2ANTTLib.ItemBarPropertyEnum.exBarHAlignCaption] := TObject(18);
		ItemBar[h1,'E',EXG2ANTTLib.ItemBarPropertyEnum.exBarToolTip] := 'Click the bar and move or resize it. The histogram-graph will be updated.';
		AddLink('Link1',h,'',h1,'E');
		Link['Link1',EXG2ANTTLib.LinkPropertyEnum.exLinkStartPos] := TObject(0);
		ExpandItem[h] := True;
	end;
	EndUpdate();
end
|
|
750
|
How can I align the text/caption on the scroll bar
with AxG2antt1 do
begin
	set_ScrollPartCaption(EXG2ANTTLib.ScrollBarEnum.exHScroll,EXG2ANTTLib.ScrollPartEnum.exLowerBackPart,'left');
	set_ScrollPartCaptionAlignment(EXG2ANTTLib.ScrollBarEnum.exHScroll,EXG2ANTTLib.ScrollPartEnum.exLowerBackPart,EXG2ANTTLib.AlignmentEnum.LeftAlignment);
	set_ScrollPartCaption(EXG2ANTTLib.ScrollBarEnum.exHScroll,EXG2ANTTLib.ScrollPartEnum.exUpperBackPart,'right');
	set_ScrollPartCaptionAlignment(EXG2ANTTLib.ScrollBarEnum.exHScroll,EXG2ANTTLib.ScrollPartEnum.exUpperBackPart,EXG2ANTTLib.AlignmentEnum.RightAlignment);
	ColumnAutoResize := False;
	Columns.Add(1);
	Columns.Add(2);
	Columns.Add(3);
	Columns.Add(4);
end
|
|
749
|
How do I programmatically control the position of the horizontal scroll bar in the chart area, so I can specify a range of dates to scorll within
with AxG2antt1 do
begin
	BeginUpdate();
	Columns.Add('Task');
	with Chart do
	begin
		LevelCount := 2;
		PaneWidth[False] := 56;
		ScrollRange[EXG2ANTTLib.ScrollRangeEnum.exStartDate] := '1/1/2001';
		ScrollRange[EXG2ANTTLib.ScrollRangeEnum.exEndDate] := '1/31/2001';
		FirstVisibleDate := '1/12/2001';
	end;
	set_ScrollPartCaption(EXG2ANTTLib.ScrollBarEnum.exHChartScroll,EXG2ANTTLib.ScrollPartEnum.exLowerBackPart,Chart.ScrollRange[EXG2ANTTLib.ScrollRangeEnum.exStartDate]);
	set_ScrollPartCaptionAlignment(EXG2ANTTLib.ScrollBarEnum.exHChartScroll,EXG2ANTTLib.ScrollPartEnum.exLowerBackPart,EXG2ANTTLib.AlignmentEnum.LeftAlignment);
	set_ScrollPartCaption(EXG2ANTTLib.ScrollBarEnum.exHChartScroll,EXG2ANTTLib.ScrollPartEnum.exUpperBackPart,Chart.ScrollRange[EXG2ANTTLib.ScrollRangeEnum.exEndDate]);
	set_ScrollPartCaptionAlignment(EXG2ANTTLib.ScrollBarEnum.exHChartScroll,EXG2ANTTLib.ScrollPartEnum.exUpperBackPart,EXG2ANTTLib.AlignmentEnum.RightAlignment);
	with Items do
	begin
		h := AddItem('Task 1');
		AddBar(h,'Task','1/15/2001','1/18/2001','K1',Nil);
		h := AddItem('Task 1');
		AddBar(h,'Task','1/5/2001','1/11/2001','K1',Nil);
	end;
	EndUpdate();
end
|
|
748
|
How can I programmatically control the position of the "splitter" between the item list on the left side and the gantt chart on the right
with AxG2antt1 do
begin
	Chart.PaneWidth[True] := 196;
end
|
|
747
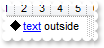
|
How can I add a milestone bar and some text in the chart area
with AxG2antt1 do
begin
	Columns.Add('Task');
	Chart.FirstVisibleDate := '1/1/2001';
	with Items do
	begin
		h := AddItem('Task 1');
		AddBar(h,'Milestone','1/2/2001','1/2/2001',Nil,'<a1>text</a> outside');
		ItemBar[h,Nil,EXG2ANTTLib.ItemBarPropertyEnum.exBarHAlignCaption] := TObject(18);
	end;
end
|
|
746
|
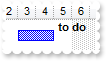
How can I display or align the bar's caption or text outside of the bar
with AxG2antt1 do
begin
	Columns.Add('Task');
	Chart.FirstVisibleDate := '1/1/2001';
	DefaultItemHeight := 32;
	with Items do
	begin
		h := AddItem('Task 1');
		AddBar(h,'Task','1/3/2001','1/5/2001','K1',Nil);
		ItemBar[h,'K1',EXG2ANTTLib.ItemBarPropertyEnum.exBarCaption] := '<b>to do</b>';
		ItemBar[h,'K1',EXG2ANTTLib.ItemBarPropertyEnum.exBarHAlignCaption] := TObject(18);
		ItemBar[h,'K1',EXG2ANTTLib.ItemBarPropertyEnum.exBarVAlignCaption] := TObject(16);
	end;
end
|
|
745
|
How can I display or align the bar's caption or text outside of the bar
with AxG2antt1 do
begin
	Columns.Add('Task');
	Chart.FirstVisibleDate := '1/1/2001';
	with Items do
	begin
		h := AddItem('Task 1');
		AddBar(h,'Task','1/4/2001','1/6/2001','K1',Nil);
		ItemBar[h,'K1',EXG2ANTTLib.ItemBarPropertyEnum.exBarCaption] := 'to do';
		ItemBar[h,'K1',EXG2ANTTLib.ItemBarPropertyEnum.exBarHAlignCaption] := TObject(16);
	end;
end
|
|
744
|
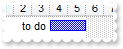
How can I display or align the bar's caption or text outside of the bar
with AxG2antt1 do
begin
	Columns.Add('Task');
	Chart.FirstVisibleDate := '1/1/2001';
	with Items do
	begin
		h := AddItem('Task 1');
		AddBar(h,'Task','1/2/2001','1/6/2001','K1',Nil);
		ItemBar[h,'K1',EXG2ANTTLib.ItemBarPropertyEnum.exBarCaption] := 'to do ';
		ItemBar[h,'K1',EXG2ANTTLib.ItemBarPropertyEnum.exBarHAlignCaption] := TObject(18);
	end;
end
|
|
743
|
Is there any option to keep the working days being constant while user moves the bar
with AxG2antt1 do
begin
	BeginUpdate();
	Chart.FirstVisibleDate := '1/1/2002';
	Chart.Bars.Add('Task:Split').Shortcut := 'Task';
	Columns.Add('Task');
	with Items do
	begin
		h := AddItem('Task 1');
		AddBar(h,'Task','1/2/2002','1/4/2002','A',Nil);
		ItemBar[h,'A',EXG2ANTTLib.ItemBarPropertyEnum.exBarKeepWorkingCount] := TObject(True);
	end;
	EndUpdate();
end
|
|
742
|
Is there any option to count or to specify the working days
with AxG2antt1 do
begin
	BeginUpdate();
	Chart.FirstVisibleDate := '1/1/2002';
	Columns.Add('Task');
	Chart.Bars.Add('Task:Split').Shortcut := 'S';
	Chart.PaneWidth[False] := 48;
	with Items do
	begin
		h := AddItem('Task 1');
		AddBar(h,'S','1/3/2002','1/4/2002','A',Nil);
		ItemBar[h,'A',EXG2ANTTLib.ItemBarPropertyEnum.exBarWorkingCount] := TObject(4);
	end;
	EndUpdate();
end
|
|
741
|
How do I select the next row/item
with AxG2antt1 do
begin
	Columns.Add('Column');
	with Items do
	begin
		AddItem('Item 1');
		AddItem('Item 2');
		AddItem('Item 3');
		SelectItem[NextVisibleItem[FocusItem]] := True;
	end;
end
|
|
740
|
How do I get the selected bars or links
with AxG2antt1 do
begin
	BeginUpdate();
	Chart.AllowSelectObjects := EXG2ANTTLib.SelectObjectsEnum.exSelectBarsOnly;
	Chart.FirstVisibleDate := '1/1/2002';
	Columns.Add('Task');
	with Items do
	begin
		h := AddItem('Task 1');
		AddBar(h,'Task','1/2/2002','1/4/2002','A',Nil);
		AddBar(h,'Task','1/6/2002','1/10/2002','B',Nil);
		ItemBar[h,'A',EXG2ANTTLib.ItemBarPropertyEnum.exBarSelected] := TObject(True);
	end;
	EndUpdate();
	OutputDebugString( 'Bars' );
	OutputDebugString( Items.SelectedObjects[EXG2ANTTLib.SelectObjectsEnum.exSelectBarsOnly] );
	OutputDebugString( 'Links' );
	OutputDebugString( Items.SelectedObjects[EXG2ANTTLib.SelectObjectsEnum.exSelectLinksOnly] );
end
|
|
739
|
How can I allow a single link being selected in the chart
with AxG2antt1 do
begin
	BeginUpdate();
	Chart.AllowSelectObjects := Integer(EXG2ANTTLib.SelectObjectsEnum.exSelectSingleObject) Or Integer(EXG2ANTTLib.SelectObjectsEnum.exSelectLinksOnly);
	Chart.FirstVisibleDate := '1/1/2002';
	Columns.Add('Task');
	with Items do
	begin
		h1 := AddItem('Task 1');
		AddBar(h1,'Task','1/2/2002','1/4/2002','A',Nil);
		h2 := AddItem('Task 2');
		AddBar(h2,'Task','1/6/2002','1/10/2002','B',Nil);
		AddLink('AB',h1,'A',h2,'B');
		AddLink('BA',h2,'B',h1,'A');
		Link['AB',EXG2ANTTLib.LinkPropertyEnum.exLinkSelected] := TObject(True);
	end;
	EndUpdate();
end
|
|
738
|
How can I allow a single bar being selected in the chart
with AxG2antt1 do
begin
	BeginUpdate();
	Chart.AllowSelectObjects := Integer(EXG2ANTTLib.SelectObjectsEnum.exSelectSingleObject) Or Integer(EXG2ANTTLib.SelectObjectsEnum.exSelectBarsOnly);
	Chart.FirstVisibleDate := '1/1/2002';
	Columns.Add('Task');
	with Items do
	begin
		h := AddItem('Task 1');
		AddBar(h,'Task','1/2/2002','1/4/2002','A',Nil);
		AddBar(h,'Task','1/6/2002','1/10/2002','B',Nil);
		ItemBar[h,'A',EXG2ANTTLib.ItemBarPropertyEnum.exBarSelected] := TObject(True);
		AddLink('AB',h,'A',h,'B');
	end;
	EndUpdate();
end
|
|
737
|
How do I define the visual appearance of the bar by using your EBN/skin files

with AxG2antt1 do
begin
	VisualAppearance.Add(1,'c:\exontrol\images\normal.ebn');
	Chart.Bars.Copy('Task','EBN').Color := $1000000;
	Chart.FirstVisibleDate := '1/1/2001';
	Columns.Add('Column');
	with Items do
	begin
		AddBar(AddItem('Item 1'),'EBN','1/2/2001','1/4/2001',Nil,Nil);
		AddBar(AddItem('Item 2'),'Task','1/2/2001','1/4/2001',Nil,Nil);
	end;
end
|
|
736
|
Is it possible to have an "empty box" pattern for the bars

with AxG2antt1 do
begin
	Chart.Bars.Copy('Task','Box').Pattern := EXG2ANTTLib.PatternEnum.exPatternBox;
	Chart.FirstVisibleDate := '1/1/2001';
	Columns.Add('Column');
	with Items do
	begin
		AddBar(AddItem('Item 1'),'Box','1/2/2001','1/4/2001',Nil,Nil);
		AddBar(AddItem('Item 1'),'Task','1/2/2001','1/4/2001',Nil,Nil);
	end;
end
|
|
735
|
How do I enable resizing ( changing the height ) the items at runtime
with AxG2antt1 do
begin
	ItemsAllowSizing := EXG2ANTTLib.ItemsAllowSizingEnum.exResizeItem;
	DrawGridLines := EXG2ANTTLib.GridLinesEnum.exHLines;
	ScrollBySingleLine := True;
	Columns.Add('Column');
	Items.AddItem('Item 1');
	with Items do
	begin
		ItemHeight[AddItem('Item 2')] := 48;
	end;
	Items.AddItem('Item 3');
end
|
|
734
|
How do I enable resizing all the items at runtime
with AxG2antt1 do
begin
	ItemsAllowSizing := EXG2ANTTLib.ItemsAllowSizingEnum.exResizeAllItems;
	DrawGridLines := EXG2ANTTLib.GridLinesEnum.exHLines;
	Columns.Add('Column');
	Items.AddItem('Item 1');
	with Items do
	begin
		ItemHeight[AddItem('Item 2')] := 48;
	end;
	Items.AddItem('Item 3');
end
|
|
733
|
How can I use your EBN files in the histogram
with AxG2antt1 do
begin
	VisualAppearance.Add(1,'c:\exontrol\images\normal.ebn');
	with Chart do
	begin
		FirstVisibleDate := '1/1/2001';
		HistogramVisible := True;
		HistogramHeight := 32;
		with Bars.Item['Task'] do
		begin
			HistogramPattern := EXG2ANTTLib.PatternEnum.exPatternEmpty;
			HistogramColor := $1000000;
		end;
	end;
	Columns.Add('Column');
	with Items do
	begin
		AddBar(AddItem('Item 1'),'Task','1/2/2001','1/4/2001',Nil,Nil);
		AddBar(AddItem('Item 1'),'Task','1/3/2001','1/7/2001',Nil,Nil);
	end;
end
|
|
732
|
How can I draw only the shape of the bars in the histogram
with AxG2antt1 do
begin
	with Chart do
	begin
		FirstVisibleDate := '1/1/2001';
		HistogramVisible := True;
		HistogramHeight := 32;
		with Bars.Item['Task'] do
		begin
			HistogramPattern := EXG2ANTTLib.PatternEnum.exBezierCurve;
			HistogramColor := $ff;
		end;
	end;
	Columns.Add('Column');
	with Items do
	begin
		AddBar(AddItem('Item 1'),'Task','1/2/2001','1/4/2001',Nil,Nil);
		AddBar(AddItem('Item 1'),'Task','1/3/2001','1/7/2001',Nil,Nil);
	end;
end
|
|
731
|
How can I draw only the shape of the bars in the histogram
with AxG2antt1 do
begin
	with Chart do
	begin
		FirstVisibleDate := '1/1/2001';
		HistogramVisible := True;
		HistogramHeight := 32;
		with Bars.Item['Task'] do
		begin
			HistogramPattern := EXG2ANTTLib.PatternEnum($100);
			HistogramColor := $ff;
		end;
	end;
	Columns.Add('Column');
	with Items do
	begin
		AddBar(AddItem('Item 1'),'Task','1/2/2001','1/4/2001',Nil,Nil);
		AddBar(AddItem('Item 1'),'Task','1/3/2001','1/7/2001',Nil,Nil);
	end;
end
|
|
730
|
How can I change the color of bars in the histogram
with AxG2antt1 do
begin
	with Chart do
	begin
		FirstVisibleDate := '1/1/2001';
		HistogramVisible := True;
		HistogramHeight := 32;
		with Bars.Item['Task'] do
		begin
			HistogramPattern := EXG2ANTTLib.PatternEnum.exPatternBDiagonal;
			HistogramColor := $ff;
		end;
	end;
	Columns.Add('Column');
	with Items do
	begin
		AddBar(AddItem('Item 1'),'Task','1/2/2001','1/4/2001',Nil,Nil);
		AddBar(AddItem('Item 1'),'Task','1/3/2001','1/7/2001',Nil,Nil);
	end;
end
|
|
729
|
How can I show my bars in the histogram
with AxG2antt1 do
begin
	with Chart do
	begin
		FirstVisibleDate := '1/1/2001';
		HistogramVisible := True;
		HistogramHeight := 32;
		Bars.Item['Task'].HistogramPattern := EXG2ANTTLib.PatternEnum.exPatternBDiagonal;
	end;
	Columns.Add('Column');
	with Items do
	begin
		AddBar(AddItem('Item 1'),'Task','1/2/2001','1/4/2001',Nil,Nil);
		AddBar(AddItem('Item 1'),'Task','1/3/2001','1/7/2001',Nil,Nil);
	end;
end
|
|
728
|
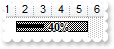
I'm trying to use the percentage display in my gantt's bars. Unfortunately, I don't see any percentage on the gantt chart
with AxG2antt1 do
begin
	Columns.Add('Task');
	Chart.FirstVisibleDate := '1/1/2001';
	with Chart.Bars.Copy('Task','BarName') do
	begin
		Color := $ff;
		Pattern := EXG2ANTTLib.PatternEnum.exPatternBDiagonal;
	end;
	Chart.Bars.Add('BarName%Progress').Shortcut := 'Percent';
	with Items do
	begin
		h := AddItem('Task 1');
		AddBar(h,'Percent','1/2/2001','1/6/2001','K1',Nil);
		ItemBar[h,'K1',EXG2ANTTLib.ItemBarPropertyEnum.exBarPercent] := TObject(0.4);
		ItemBar[h,'K1',EXG2ANTTLib.ItemBarPropertyEnum.exBarShowPercentCaption] := TObject(True);
	end;
end
|
|
727
|
How can I show the histogram
with AxG2antt1 do
begin
	Chart.LevelCount := 2;
	Chart.Level[0].Label := TObject(0);
	with Chart.Level[1] do
	begin
		Label := '<%mr%>';
		Unit := EXG2ANTTLib.UnitEnum.exMonth;
	end;
	Chart.HistogramVisible := True;
end
|
|
726
|
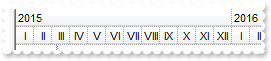
How I can show Months in Time Unit panel into Roman numerals
with AxG2antt1 do
begin
	Chart.LevelCount := 2;
	Chart.Level[0].Label := TObject(0);
	with Chart.Level[1] do
	begin
		Label := '<%mr%>';
		Unit := EXG2ANTTLib.UnitEnum.exMonth;
	end;
end
|
|
725
|
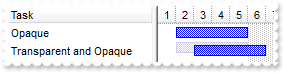
Can I show a bar with a different vertical position
with AxG2antt1 do
begin
	Columns.Add('Task');
	Chart.FirstVisibleDate := '1/1/2001';
	with Items do
	begin
		h := AddItem('Opaque');
		AddBar(h,'Task','1/2/2001','1/6/2001','K1',Nil);
		h := AddItem('Transparent and Opaque');
		AddBar(h,'Task','1/2/2001','1/6/2001','K1',Nil);
		ItemBar[h,'K1',EXG2ANTTLib.ItemBarPropertyEnum.exBarOffset] := '-3';
		ItemBar[h,'K1',EXG2ANTTLib.ItemBarPropertyEnum.exBarTransparent] := TObject(80);
		AddBar(h,'Task','1/3/2001','1/7/2001','K2',Nil);
	end;
end
|
|
724
|
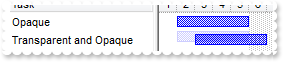
How can I show transparent and opaque bars in the same chart
with AxG2antt1 do
begin
	Columns.Add('Task');
	Chart.FirstVisibleDate := '1/1/2001';
	with Items do
	begin
		h := AddItem('Opaque');
		AddBar(h,'Task','1/2/2001','1/6/2001','K1',Nil);
		h := AddItem('Transparent and Opaque');
		AddBar(h,'Task','1/2/2001','1/6/2001','K1',Nil);
		ItemBar[h,'K1',EXG2ANTTLib.ItemBarPropertyEnum.exBarOffset] := '-3';
		ItemBar[h,'K1',EXG2ANTTLib.ItemBarPropertyEnum.exBarTransparent] := TObject(80);
		AddBar(h,'Task','1/3/2001','1/7/2001','K2',Nil);
	end;
end
|
|
723
|
How can I draw bars using transparent colors
with AxG2antt1 do
begin
	Chart.ShowTransparentBars := 60;
	Chart.FirstVisibleDate := '1/1/2001';
	Chart.Bars.Copy('Task','TaskR').Color := $ff;
	Chart.PaneWidth[False] := 48;
	Columns.Add('Column');
	with Items do
	begin
		h := AddItem('Item 1');
		AddBar(h,'Task','1/2/2001','1/5/2001','A',Nil);
		AddBar(h,'TaskR','1/4/2001','1/7/2001','B',Nil);
	end;
end
|
|
722
|
How do I select bars and links in the chart area, by dragging
with AxG2antt1 do
begin
	BeginUpdate();
	Chart.AllowSelectObjects := EXG2ANTTLib.SelectObjectsEnum.exSelectObjects;
	Chart.FirstVisibleDate := '1/1/2002';
	Columns.Add('Task');
	with Items do
	begin
		h1 := AddItem('Task 1');
		AddBar(h1,'Task','1/2/2002','1/4/2002','A',Nil);
		h2 := AddItem('Task 2');
		AddBar(h2,'Task','1/6/2002','1/10/2002','B',Nil);
		AddLink('AB',h1,'A',h2,'B');
	end;
	EndUpdate();
end
|
|
721
|
How do I remove, delete the objects like bars and links selected in the chart area
with AxG2antt1 do
begin
	BeginUpdate();
	Chart.AllowSelectObjects := EXG2ANTTLib.SelectObjectsEnum.exSelectObjects;
	Chart.FirstVisibleDate := '1/1/2002';
	Columns.Add('Task');
	with Items do
	begin
		h1 := AddItem('Task 1');
		AddBar(h1,'Task','1/2/2002','1/4/2002','A',Nil);
		ItemBar[h1,'A',EXG2ANTTLib.ItemBarPropertyEnum.exBarSelected] := TObject(True);
		h2 := AddItem('Task 2');
		AddBar(h2,'Task','1/6/2002','1/10/2002','B',Nil);
		AddLink('AB',h1,'A',h2,'B');
	end;
	EndUpdate();
	Chart.RemoveSelection();
end
|
|
720
|
How do I select links and bars in the chart area
with AxG2antt1 do
begin
	BeginUpdate();
	Chart.AllowSelectObjects := EXG2ANTTLib.SelectObjectsEnum.exSelectObjects;
	Chart.FirstVisibleDate := '1/1/2002';
	Columns.Add('Task');
	with Items do
	begin
		h1 := AddItem('Task 1');
		AddBar(h1,'Task','1/2/2002','1/4/2002','A',Nil);
		ItemBar[h1,'A',EXG2ANTTLib.ItemBarPropertyEnum.exBarSelected] := TObject(True);
		h2 := AddItem('Task 2');
		AddBar(h2,'Task','1/6/2002','1/10/2002','B',Nil);
		ItemBar[h2,'B',EXG2ANTTLib.ItemBarPropertyEnum.exBarSelected] := TObject(True);
		AddLink('AB',h1,'A',h2,'B');
		Link['AB',EXG2ANTTLib.LinkPropertyEnum.exLinkSelected] := TObject(True);
	end;
	EndUpdate();
end
|
|
719
|
How do I select links in the chart area
with AxG2antt1 do
begin
	BeginUpdate();
	Chart.AllowSelectObjects := EXG2ANTTLib.SelectObjectsEnum.exSelectLinksOnly;
	Chart.FirstVisibleDate := '1/1/2002';
	Columns.Add('Task');
	with Items do
	begin
		h1 := AddItem('Task 1');
		AddBar(h1,'Task','1/2/2002','1/4/2002','A',Nil);
		h2 := AddItem('Task 2');
		AddBar(h2,'Task','1/6/2002','1/10/2002','B',Nil);
		AddLink('AB',h1,'A',h2,'B');
		Link['AB',EXG2ANTTLib.LinkPropertyEnum.exLinkSelected] := TObject(True);
	end;
	EndUpdate();
end
|
|
718
|
How do I select bars, or tasks in the chart area
with AxG2antt1 do
begin
	BeginUpdate();
	Chart.AllowSelectObjects := EXG2ANTTLib.SelectObjectsEnum.exSelectBarsOnly;
	Chart.FirstVisibleDate := '1/1/2002';
	Columns.Add('Task');
	with Items do
	begin
		h := AddItem('Task 1');
		AddBar(h,'Task','1/2/2002','1/4/2002','A',Nil);
		AddBar(h,'Task','1/6/2002','1/10/2002','B',Nil);
		ItemBar[h,'A',EXG2ANTTLib.ItemBarPropertyEnum.exBarSelected] := TObject(True);
		AddLink('AB',h,'A',h,'B');
	end;
	EndUpdate();
end
|
|
717
|
Can I change the Task bar so it display a Progress or a Percent bar, but it is splitted when the task intersect a non working area
with AxG2antt1 do
begin
	with Chart do
	begin
		ShowTransparentBars := 60;
		FirstVisibleDate := '1/1/2001';
		Bars.Add('Task%Progress:Split').Shortcut := 'Task';
		PaneWidth[False] := 48;
	end;
	Columns.Add('Column');
	with Items do
	begin
		h := AddItem('Item 1');
		AddBar(h,'Task','1/2/2001','1/16/2001','K1',Nil);
		ItemBar[h,'K1',EXG2ANTTLib.ItemBarPropertyEnum.exBarPercent] := TObject(0.15);
		ItemBar[h,'K1',EXG2ANTTLib.ItemBarPropertyEnum.exBarShowPercentCaption] := TObject(True);
	end;
end
|
|
716
|
Can I change the Task bar so it display a Progress or a Percent bar

with AxG2antt1 do
begin
	with Chart do
	begin
		FirstVisibleDate := '1/1/2001';
		Bars.Add('Task%Progress').Shortcut := 'Task';
	end;
	Columns.Add('Column');
	with Items do
	begin
		h := AddItem('Item 1');
		AddBar(h,'Task','1/2/2001','1/5/2001','K1',Nil);
		ItemBar[h,'K1',EXG2ANTTLib.ItemBarPropertyEnum.exBarPercent] := TObject(0.15);
		ItemBar[h,'K1',EXG2ANTTLib.ItemBarPropertyEnum.exBarShowPercentCaption] := TObject(True);
	end;
end
|
|
715
|
How can I remove the filter
with AxG2antt1 do
begin
	with (Columns.Add('Column') as EXG2ANTTLib.Column) do
	begin
		DisplayFilterButton := True;
		FilterType := EXG2ANTTLib.FilterTypeEnum.exBlanks;
	end;
	ApplyFilter();
	ClearFilter();
end
|
|
714
|
I use the ShowEmptyBars property, but I display seconds from 15 to 15, and the bars are not shown correctly. What can I do
with AxG2antt1 do
begin
	SelBackColor := Color.FromArgb(255,0,0);
	BeginUpdate();
	with Chart do
	begin
		AllowCreateBar := EXG2ANTTLib.CreateBarEnum.exCreateBarAuto;
		FirstVisibleDate := '1/1/2002';
		LevelCount := 2;
		Level[0].Label := TObject(1048576);
		with Level[1] do
		begin
			Label := '<%ss%>';
			Count := 15;
		end;
		ShowEmptyBars := 15;
		ShowEmptyBarsUnit := EXG2ANTTLib.UnitEnum.exSecond;
		PaneWidth[False] := 48;
	end;
	Columns.Add('Task');
	with Items do
	begin
		h := AddItem('Task 1');
		AddBar(h,'Task','1/1/2002 12:00:15 AM','1/1/2002 12:00:15 AM','A',Nil);
		AddBar(h,'Task','1/1/2002 12:01:15 AM','1/1/2002 12:01:30 AM','B',Nil);
		AddLink('AB',h,'A',h,'B');
	end;
	EndUpdate();
end
|
|
713
|
I need the bar works like in the MS Project, where task from 1/1/2001 to 1/1/2001 must display 1 day
with AxG2antt1 do
begin
	Chart.FirstVisibleDate := '1/1/2001';
	Chart.ShowEmptyBars := 1;
	Columns.Add('Column');
	with Items do
	begin
		AddBar(AddItem('Item 1'),'Task','1/1/2001','1/1/2001',Nil,Nil);
	end;
end
|
|
712
|
I have a bar that has the start and end date identical. Nothing is displayed. What can I do
with AxG2antt1 do
begin
	Chart.FirstVisibleDate := '1/1/2001';
	Chart.ShowEmptyBars := 1;
	Columns.Add('Column');
	with Items do
	begin
		AddBar(AddItem('Item 1'),'Task','1/2/2001','1/2/2001',Nil,Nil);
	end;
end
|
|
711
|
How can I display seconds and bars for 15 to 15
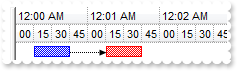
with AxG2antt1 do
begin
	BeginUpdate();
	Chart.AllowCreateBar := EXG2ANTTLib.CreateBarEnum.exCreateBarAuto;
	Chart.FirstVisibleDate := '1/1/2002';
	Chart.LevelCount := 2;
	Chart.ShowEmptyBars := 0;
	Chart.Level[0].Label := TObject(1048576);
	with Chart.Level[1] do
	begin
		Label := '<%ss%>';
		Count := 15;
	end;
	Chart.PaneWidth[False] := 48;
	Chart.Bars.Copy('Task','Task2').Color := $ff;
	Columns.Add('Task');
	with Items do
	begin
		h := AddItem('Task 1');
		AddBar(h,'Task','1/1/2002 12:00:15 AM','1/1/2002 12:00:45 AM','A',Nil);
		AddBar(h,'Task2','1/1/2002 12:01:15 AM','1/1/2002 12:01:45 AM','B',Nil);
		AddLink('AB',h,'A',h,'B');
	end;
	EndUpdate();
end
|
|
710
|
How can I vertically display the column's caption, in the header

with AxG2antt1 do
begin
	(Columns.Add('A') as EXG2ANTTLib.Column).HeaderVertical := True;
	(Columns.Add('B') as EXG2ANTTLib.Column).HeaderVertical := True;
	(Columns.Add('H') as EXG2ANTTLib.Column).HeaderVertical := False;
end
|
|
709
|
How can I copy a predefined bar
with AxG2antt1 do
begin
	Chart.Bars.Copy('Task','T2').Color := $ff;
	Chart.FirstVisibleDate := '1/1/2001';
	Columns.Add('Column');
	with Items do
	begin
		AddBar(AddItem('Item 1'),'T2','1/2/2001','1/4/2001',Nil,Nil);
	end;
end
|
|
708
|
How can I define my own custom bar, using my icons or pictures

with AxG2antt1 do
begin
	Images('gBJJgBAIDAAGAAEAAQhYAf8Pf4hh0QihCJo2AEZjQAjEZFEaIEaEEaAIAkcbk0olUrlktl0vmExmUzmk1m03nE5nU7nk9n0/oFBoVDolFo1HpFJpVLplNp1PqFRqVTql' +
	'Vq1XrFZrVbrldr1fsFhsVjslls1ntFptVrtltt1vuFxuVzul1u13vF5vV7vl9v1/wGBwWDwmFw2HxGJxWLxmNx0xiFdyOTh8Tf9ZymXx+QytcyNgz8r0OblWjyWds+m0' +
	'ka1Vf1ta1+r1mos2xrG2xeZ0+a0W0qOx3GO4NV3WeyvD2XJ5XL5nN51aiw+lfSj0gkUkAEllHanHI5j/cHg8EZf7w8vl8j4f/qfEZeB09/vjLAB30+kZQAP/P5/H6/yN' +
	'AOAEAwCjMBwFAEDwJBMDwLBYAP2/8Hv8/gAGAD8LQs9w/nhDY/oygIA=');
	with Chart.Bars do
	begin
		AddShapeCorner(TObject(12345),TObject(1));
		AddShapeCorner(TObject(22345),TObject(2));
		with Add('T2') do
		begin
			StartShape := EXG2ANTTLib.ShapeCornerEnum($5740 Or Integer(EXG2ANTTLib.ShapeCornerEnum.exShapeIconCircleUp1));
			EndShape := EXG2ANTTLib.ShapeCornerEnum($3020 Or Integer(EXG2ANTTLib.ShapeCornerEnum.exShapeIconVBar) Or Integer(EXG2ANTTLib.ShapeCornerEnum.exShapeIconRight));
			EndColor := $ff;
			Pattern := EXG2ANTTLib.PatternEnum.exPatternDot;
			Color := $ff00ff;
			Shape := EXG2ANTTLib.ShapeBarEnum.exShapeThinCenter;
		end;
	end;
	Chart.FirstVisibleDate := '1/1/2001';
	Columns.Add('Column');
	with Items do
	begin
		AddBar(AddItem('Item 1'),'T2','1/2/2001','1/4/2001',Nil,Nil);
	end;
end
|
|
707
|
How can I access a predefined bar
with AxG2antt1 do
begin
	Chart.FirstVisibleDate := '1/1/2001';
	Columns.Add('Column');
	with Items do
	begin
		AddBar(AddItem('Item 1'),'Task','1/2/2001','1/4/2001',Nil,Nil);
	end;
	Chart.Bars.Item['Task'].Color := $ff;
end
|
|
706
|
How can I access a predefined bar
with AxG2antt1 do
begin
	Chart.FirstVisibleDate := '1/1/2001';
	Columns.Add('Column');
	with Items do
	begin
		AddBar(AddItem('Item 1'),'Task','1/2/2001','1/4/2001',Nil,Nil);
	end;
	Chart.Bars.Item['Task'].Color := $ff;
end
|
|
705
|
How can I remove all predefined bars
with AxG2antt1 do
begin
	Chart.FirstVisibleDate := '1/1/2001';
	Columns.Add('Column');
	with Items do
	begin
		AddBar(AddItem('Item 1'),'Task','1/2/2001','1/4/2001',Nil,Nil);
	end;
end
|
|
704
|
How can I remove a predefined bar
with AxG2antt1 do
begin
	Chart.FirstVisibleDate := '1/1/2001';
	Columns.Add('Column');
	with Items do
	begin
		AddBar(AddItem('Item 1'),'Task','1/2/2001','1/4/2001',Nil,Nil);
	end;
end
|
|
703
|
How do I get the number of predefined bars
with AxG2antt1 do
begin
	Columns.Add(AxG2antt1.Chart.Bars.Count);
end
|
|
702
|
How can I change the shape of the task bar

with AxG2antt1 do
begin
	with Chart.Bars.Copy('Task','T2') do
	begin
		EndShape := EXG2ANTTLib.ShapeCornerEnum.exShapeIconDown1;
		EndColor := $ff;
	end;
	Chart.FirstVisibleDate := '1/1/2001';
	Columns.Add('Column');
	with Items do
	begin
		AddBar(AddItem('Item 1'),'T2','1/2/2001','1/4/2001',Nil,Nil);
		AddBar(AddItem('Item 2'),'Task','1/2/2001','1/4/2001',Nil,Nil);
	end;
end
|
|
701
|
How can I change the ending shape for all task bars

with AxG2antt1 do
begin
	with Chart.Bars.Item['Task'] do
	begin
		EndShape := EXG2ANTTLib.ShapeCornerEnum.exShapeIconUp1;
		EndColor := $ff;
	end;
	Chart.FirstVisibleDate := '1/1/2001';
	Columns.Add('Column');
	with Items do
	begin
		AddBar(AddItem('Item 1'),'Task','1/2/2001','1/4/2001',Nil,Nil);
	end;
end
|